Good Day Traders
While BITCOIN is insinuating it’s bearish, the facts don’t lie. TA may read bearish while at the same time price action shows and reads bullish. Smart Money Movements has confirmed it.
These two don’t go together but, interestingly, they have something in common: TA manipulation while the deeper facts say more to us.
We have a 3-year BULL CYCLE. This does not mean BITCOIN will be all bullish and while it’s traveling to SPACE, there will be some fearful downtrends.
Even though it is a 3-year BULL CYCLE, it’s not to be treated as entry or exit.
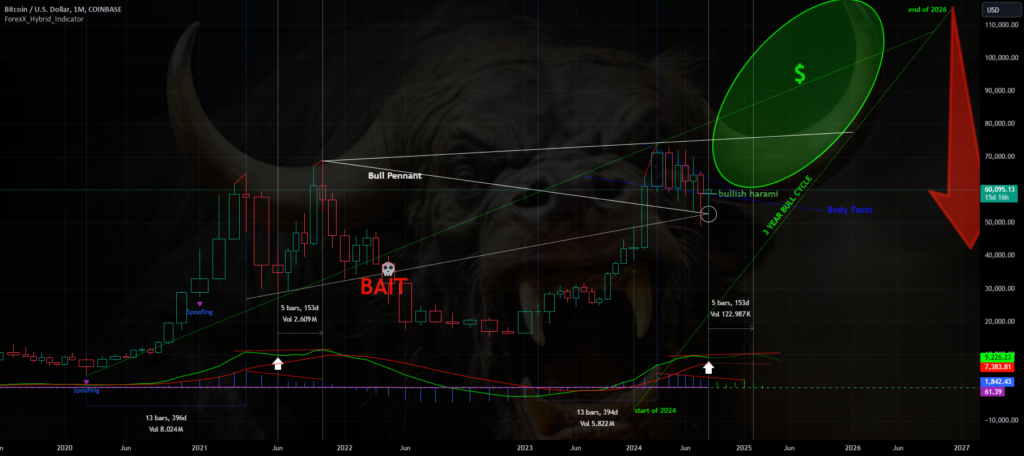
Here we have a 1MONTH TF. I’ve laid out a long green bull cycle trend from start to finish.
The oval means you and I do not know where the uptrend ends because prices and momentum get updated hourly.
I’ve laid out some interesting trendlines. While there’s a bullish flag, let’s walk through this together to see what else we could find! “GREAT LET’S GET STARTED”
1. Two white trendlines have formed into a failed bullish pennant or to say; a bullish triangle
with BAIT TRAP.
2. The bullish flag; I’ve used blue trendlines and used only candlestick body facts which now
reads a falling wedge pattern based on body facts with a bull harami.
3. I’ve added a white trendline above the bullish triangle by topping 2 top wicks.
4. All three patterns show an uptrend which is meaningless to me because if my algorithm does
not agree with any of them then I’d void them out.
I’ve added a date range of 13 bars; see both
I’ve added a date range which is a countdown of 5 bars from the beginning of the second wave as I’ve applied the same method at the location of the bull flag or falling wedge of 5 bars. This helps us have a date range estimate.
My ForexX hybrid indicator has been customized for a future read based on volume and also includes spoofing.


