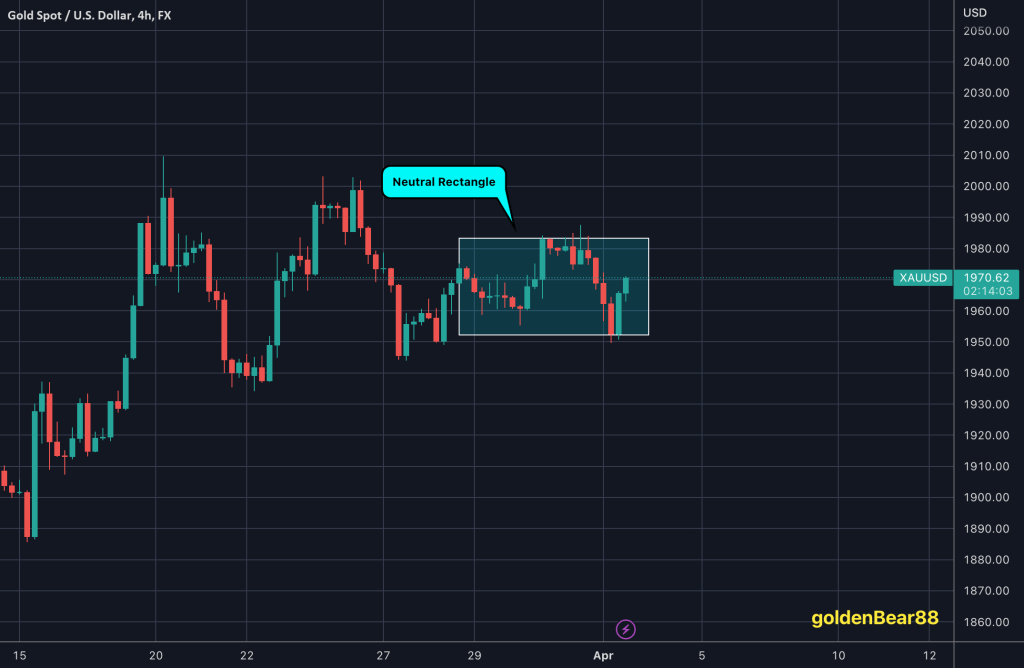
Technical analysis: No surprises so far as Gold still didn’t broke the last barrier of #1,991.80 on Spot prices, confirming the last upside wave towards the #2-Month old Resistance zone. Daily and Hourly charts turned Bullish again but based on the Weekly chart’s (#1W) candle regression since end of September, it is safer to Sell after every red engulfing Daily candles (those were on June #4, July #9 and August #2). Bond Yields are on critical crossroads and should stay above #3.450 first Support, as their spiral downtrend had Bullish after-effect on Gold (Weekly chart is however on # +2.27%). Gold is now Technically and Fundamentally equipped for Buying sequence in continuation, but it is still early to speculate on exact timing since this is first session of Trading week. Technically, both on Oscillators and Candlesticks, Gold should gain value with every Hourly 4 chart’s candle minimum towards #2,000.80. (Higher High’s local peak extension). Gold is holding it’s ground on the Hourly 4 chart (Ranged (leans to Bullish) Friday’s U.S. session opening and further Hours came as no Technical surprise) as the Price-action rallies, staying above Daily chart’s former Symmetrical Triangle but preserving the Bullish underlying Short-term trend. As long as Gold keep #1,960.80 Support intact, I give more probabilities to the upside – since Price-action failed to test Support and Higher High’s Lower zone extension.
Fundamental analysis: The reason is Bearish Intra-day trend on Bond Yields (but Bullish Medium-term) and Gold used as an hedge against Inflation and recession fears rising globally. The Price-action should soon connect with the Hourly 4 chart’s Resistance, which was a trend setter lately and every time it didn’t succeed to hold, Gold risen more than #35 points within #2-session horizon. Personally, after weak Bearish display throughout Thursday’s session, I still favor going Bullish on the Short-term, but ideally I would want to see local High’s broken firmly to be more certain. This week’s Bullish rebound was led by once again enormous Buying pressure from Fundamental side, which is visible now on almost flat Daily chart’s candle, but the Weekly candle closed near a respectable (# -0.44%). This remains an undisputed Short-term Bullish trend, but I doubt that it will last if #2,000.80 benchmark isn’t tested and invalidated as soon as possible. Always consider the Medium-term trend when determining your positioning along with the Highly correlated instruments (DX and Bond Yields, partly Usd-Jpy). The Monthly candle however remains on a mere (# +6.46%), and above is a positive close, so practically the Bullish underlying trend is unchanged. According to the Weekly chart’s pointers, Gold is on a verge to invalidate #2,000.80 psychological benchmark and extend Buying sequence towards #2,027.80 Higher High’s Upper zone, however if Buyer’s intent is not that strong and #1,991.80 – #2,000.80 Medium-term Resistance zone rejects the Price-action (delivering shift from Triple to Quadruple Top), sequence will arise Medium-term Sellers which may push the Price-action all the way towards #1,852.80 – #1,900.80 wide Support zone ahead of Stabilization area.


