Gold Price (XAU/USD) Analysis and Chart
• Gold prices have fallen since the Fed’s call
• The market still has higher interest rates on its mind, and not only in the US
• Still, it may have suffered enough for the short term.
Recommended by David Cottle
How to Trade Gold
Gold prices slipped further in Asia and Europe on Thursday as this market like all others digested the United States Federal Reserve’s widely anticipated decision to pause its long interest-rate hiking cycle in the previous session.
As higher interest rates tend to hit non-yielding assets like gold hard, the Fed’s call might have been expected to support the market. However, the US central bank seems to have decided that the hiatus is to be little more than what might be (and surely will be) termed a ‘hawkish pause.’
What that means is that, while the central bank fully expects to increase the Federal funds rate again, possibly more than once, it intends to wait a while and gauge the effect of its previous set of increases.
With this in mind, it’s less hard to see why the gold market should have slipped. Hopes that the US might be close to ending its cycle of monetary tightening are arguably the brightest spot for investors in the oldest haven. Most other central banks are still likely in the thick of theirs given the global stubbornness of inflation.
Still, rampant inflation will probably keep a floor under the gold market, While the true utility of the metal as a hedge against rising prices is a subject of endless economic debate, plentiful investors insist that it is. It’s notable that prices remain close to historic high levels despite much higher interest rates more or less everywhere.
The backdrop of war in Ukraine, tensions in the South China Sea, and the durability of post-covid recovery are also clearly supportive of perceived ‘haven assets.’
The week has a bit of event risk left for this market, with US retail sales and sentiment data likely to leave their mark on interest rate expectations and, through them, on gold.
of clients are net long. of clients are net short.
| Change in | Longs | Shorts | OI |
| Daily | -8% | -2% | -6% |
| Weekly | 17% | -25% | 2% |
Gold Prices Technical Analysis

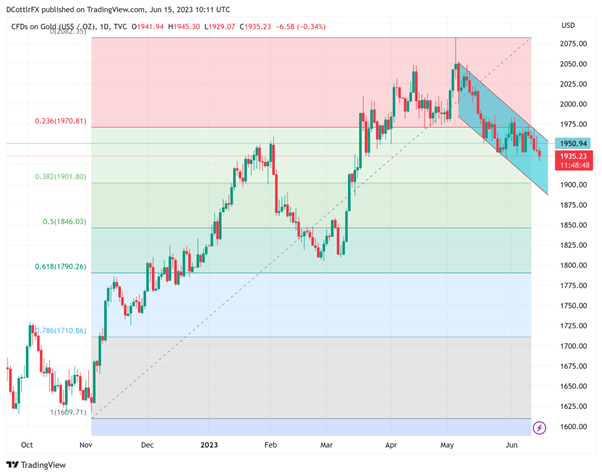
Having declined sharply from the highs of early May, gold prices are now flirting with psychological support at $1930/ounce. They’ve been below it on an inta-day basis this session and a daily or weekly close below there would be a first for very nearly three months.
Should that point give way focus would probably move very quickly on to support at $1901.80. That’s where the second Fibonacci retracement of the rise from November’s lows to May’s peaks comes in.
The bears would need to really grasp the reins to push the market much lower than that, however, but, should they do so, the $1825 level at which the market bounced back in March will probably be in focus.
Bulls have plenty of work ahead of them, but their first order of business will probably be to try and attack the upper bound of the current descending channel. That comes in at $1958.81 on Thursday, not too far above the current market. However, an attack on that will require a bigger daily move than we’ve seen so far this week and it’s far from certain that such impetus is out there.
IG’s own sentiment data suggest that the market could be set to fight back a little after recent heavy losses. 72% of respondents are apparently bullish at current levels.
–By David Cottle for DailyFX

