Article by IG Senior Market Analyst Axel Rudolph
FTSE 100, DAX 40, S&P 500 Prices, Analysis, and Charts
Recommended by IG
Traits of Successful Traders
FTSE 100 to open higher
The FTSE 100 continues to underperform its peers as worries about the utility sector, with the potential demise of Thames Water, and higher UK yields weigh on the index. On the back of much stronger-than-expected US GDP data, at 2% in Q1 2023 versus an expected 1.4%, and successful US bank stress test results, US indices helped Asian indices to rise into month and quarter end with European indices opening higher as well.
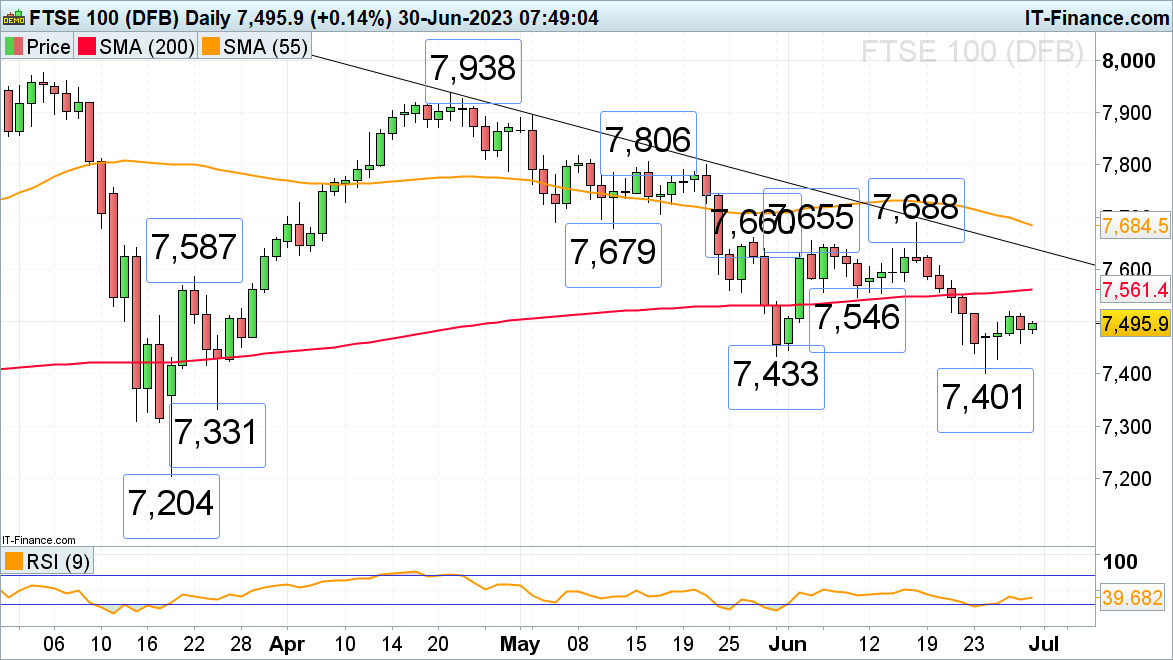
The UK blue chip index is trying to finish the quarter on a positive note and might revisit this week’s high at 7,518. Beyond there meanders the 200-day simple moving average (SMA) at 7,561 which is unlikely to be reached today, though. A drop through Thursday’s low at 7,459 would void this short-term bullish outlook and instead, point to the 7,433 May low being back in sight.
Only a fall through this week’s low at 7,401 on a daily chart closing basis would have further negative implications with the 24 March low at 7,331 and also the 7,204 March low then being eyed.
FTSE 100 Daily Price Chart

Trade Smarter – Sign up for the DailyFX Newsletter
Receive timely and compelling market commentary from the DailyFX team
Subscribe to Newsletter
DAX 40 pushes higher into quarter end
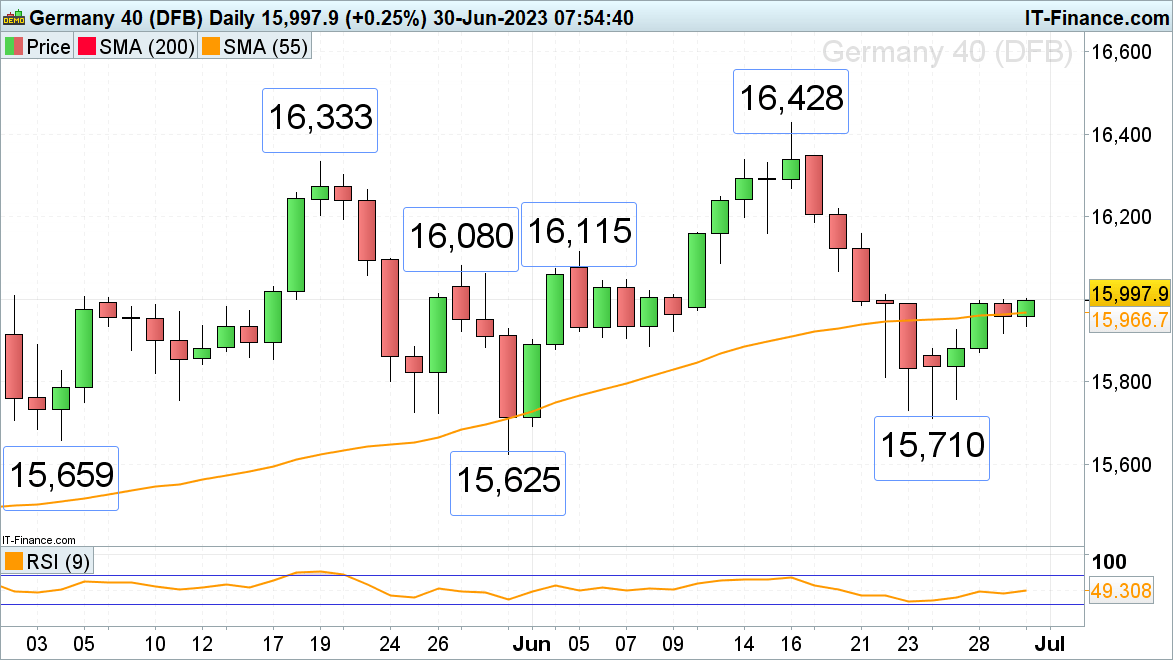
The DAX 40 has been trying to break through the minor psychological 16,000 barrier for the past three days but may be successful in doing so today with it being the end of the month and quarter. In this case, the late May and early June highs at 16,80 to 16,115 could be reached but may cap.
A tumble through Wednesday’s low at 15,918 would void the short-term bullish stance, however, and instead point toward the late May and current June lows at 15,710 to 15,625 being revisited over the coming weeks.
DAX 40 Daily Price Chart

S&P 500 rises for the third day in a row
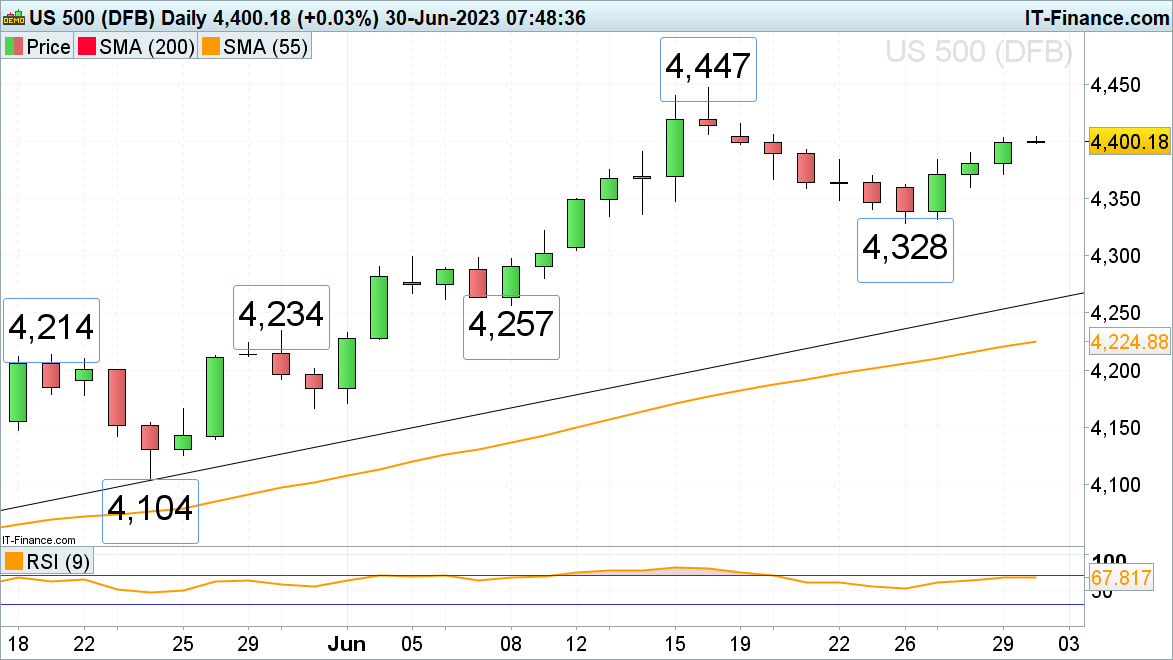
The S&P 500 has risen for three consecutive days on solid economic data and despite two more Federal Reserve (Fed) rate hikes expected to be seen.A rise above Thursday’s high at 4,404 would leave the way open for a move toward the current June high at 4,447 high to be reached.
Only a bearish reversal to below Thursday’s low at 4,371 would invalidate the short-term bullish outlook and could lead to Monday’s 4,328 low being back in the frame. Were a fall through this week’s low at 4,328 to unfold, the early June high at 4,300 would be targeted.
S&P 500 Daily Price Chart


