US Crude Oil Price Forecast: Bearish
- Prices have weakened sharply after a strong run higher
- Awful Chinese economic data has sapped confidence
- This is unlikely to change in the week ahead, but keep an eye on Jackson Hole
Recommended by David Cottle
How to Trade Oil
Crude Oil prices have snapped a seven-week winning streak with investors now focused on the clear possibility of reduced energy demand, rather than the certainty of tightening supply.
The past few weeks have bought more shaky economic news from China, perhaps crowned by the disturbing release of consumer price data showing the country in full deflation. The faltering of China’s post-Covid recovery is further underlined by problems at some of its vast real-estate developers with one of the largest, Country Garden, in the grip of a debt crisis.
China is the world’s largest energy importer and any sign that its economy is stagnating will always be bad news for oil bulls. To make matters worse it seems that China’s economic woes are deep, widespread, and structural, so more resistant to any kind of quick fix. Beijing has loosened both monetary and fiscal constraints, but Western China watchers remain extremely cautious about its chances of early success.
Japan obviously provides no exact parallels with China, but investors will be uncomfortably aware of how long and fruitless its attempts to reignite lost domestic demand have been.
The oil market has also added the United States to its worry list. The release of minutes from the Federal Reserve’s July interest-rate-setting meeting revealed a central bank far from ready to declare the war against inflation won, acutely aware that borrowing costs might have further to rise than the markets’ optimists had let themselves hope.
The idea that US monetary policy tightening was close to its peak has certainly supported oil prices. But now that peak looks a little further off, with a predictable effect on prices.
For now, the pesky global economy is dominating the oil market, overshadowing the effect of production cuts already delivered, and indeed extended, by the Organization of Petroleum Exporting Countries. In concert with Russia, they’ve reduced output by nearly a million barrels per day this year, facilitated largely by voluntary reductions from Saudi Arabia.
At face value there’s not much on the economic calendar likely to shake the oil market out of the blues in the week ahead, hence the bearish call at the top of this page. Inventory data from the US Energy Information Administration is coming up on Wednesday, with heavyweight durable goods orders out of the US a day later. Both will likely be of interest, neither is likely to produce lasting effects.
The wild card is the Jackson Hole symposium of central bankers, held in Wyoming under the auspices of the Kansas City Fed. Jerome Powell roiled global markets last year by pledging to curb inflation whatever pain that took. It’s safe to say markets will be keen to see what he follows with this year, the oil market included.
US Crude Oil Technical Analysis

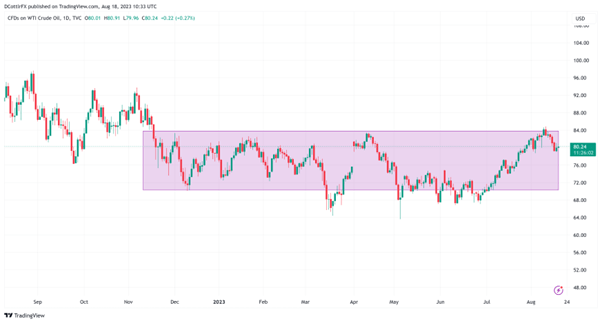
Daily US WTI Chart Created Using TradingView
The West Texas Intermediate crude benchmark daily chart retains the odd quirk of trading sharply back into a broad band between the low of December 9 at $70.30 and the peak of April 12 at $83.50 whenever it leaves it.
This may of course be nothing more than a somewhat extended Northern hemisphere ‘summer lull’ trading pattern, in which case it might be expected to break in the next couple of weeks. Still, the market is clearly uncomfortable outside that band and keen to get back in it. It has done so more often on a downside break so far, but that’s because the lower bound has faced more frequent tests. Certainly, August 9’s attempt at the top was quickly beaten back.
For now the market grapples with support well inside that trading band at $80/barrel. A break below that would likely put focus on July 13’s high of $77.30. If bulls can consolidate above the figure then they’ll probably make another assault on the $83.50 area, but it would be a brave trader who’d expect the market to stay above there for very long under current conditions.
IG’s own client sentiment indicator doesn’t offer much help, showing traders quite finely balanced between bulls and bears at current levels, with a modest bias to the latter.
Learn More About IG Client Sentiment – Download the Free Guide Below.
of clients are net long. of clients are net short.
| Change in | Longs | Shorts | OI |
| Daily | -4% | 4% | 0% |
| Weekly | 4% | -17% | -8% |
–By David Cottle For DailyFX

