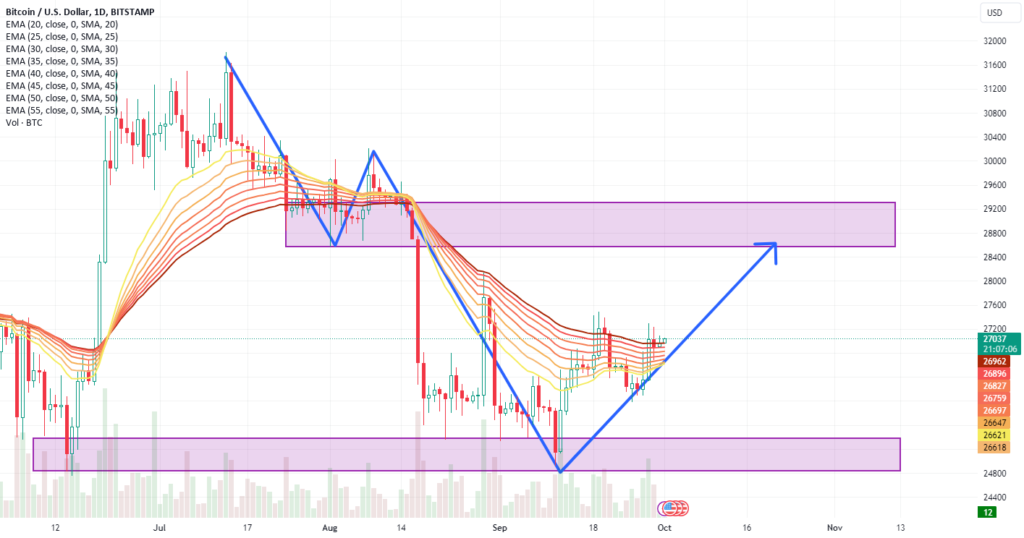
The death cross, a market chart pattern, indicates recent price weakness, occurring when the short-term moving average falls below the long-term moving average.
Specifically, Cowen highlighted the paradox it has historically witnessed as it approaches the death cross, only to see subsequent declines marked by lower lows. Cowen explains that these market indicators, especially the 50-day and 200-day moving averages, are lagging models. This lag often leads to price increases before the death cross and price decreases after the Golden Cross, creating an “unpredictable” cycle in the cryptocurrency market.
Notably, Bitcoin’s recent recovery, although seemingly promising, has led to lower highs, reinforcing Cowen’s analysis of the current downtrend.
As traders and enthusiasts closely monitor BTC’s movements, Cowen’s profound insights provide valuable perspectives on the current market forecast.
Cowen’s analysis underscores the complex interplay between market indicators and investor behavior in the cryptocurrency field. As it enters this critical phase, it continues to attract global attention as a barometer of momentum in the context of digital assets.


