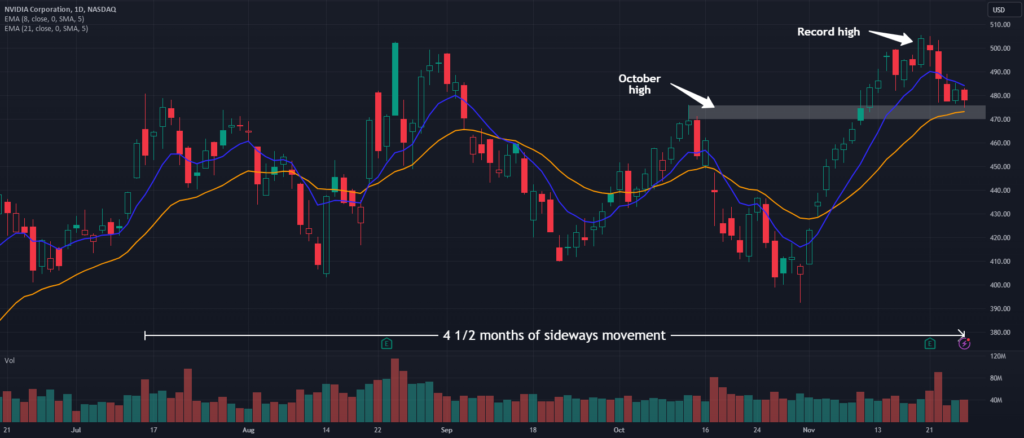
Nvidia is the top performing member of the S&P 500 this year, up 227 percent. Despite that big move, the chip giant has actually gone nowhere for over four months. But will that remain the case into yearend? The first pattern on today’s chart is the price area between $470 and $476. That roughly matches NVDA’s high in mid-October (depending on whether you take intraday or closing prints). The stock has attempted to stabilize in this zone in the last four sessions. Can it keep holding and turn …

Nvidia Pulls Back After Earnings for NASDAQ:NVDA by TradeStation
Nvidia is the top performing member of the S&P 500 this year, up 227 percent. Despite that big move, the chip giant has actually gone nowhere for over four months. But will that remain the case into yearend? The first pattern on today’s chart is the price area between $470 and $476. That roughly matches…
Shares:

