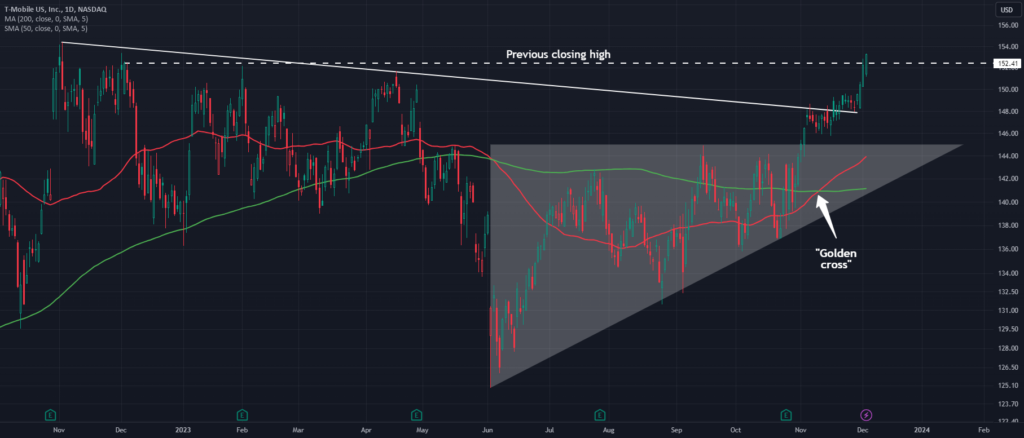
T-Mobile US has barely moved since mid-2021, but now it may be attempting a breakout. The first pattern on today’s chart is the series of higher lows since June. Notice how the wireless stock apparently broke the top of that ascending triangle last month. That may signal continuation to the upside. Next, a falling trendline along the highs of November 2022 and April 2023 offered resistance. But, it gave way last week. Third, the 50-day simple moving average (SMA) had a “golden cross” above …

Potential Breakout in T-Mobile for NASDAQ:TMUS by TradeStation
T-Mobile US has barely moved since mid-2021, but now it may be attempting a breakout. The first pattern on today’s chart is the series of higher lows since June. Notice how the wireless stock apparently broke the top of that ascending triangle last month. That may signal continuation to the upside. Next, a falling trendline…
Shares:

