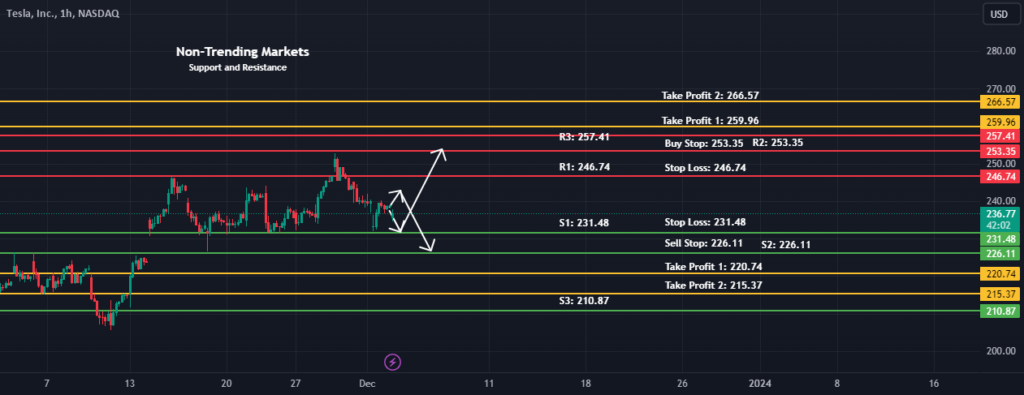
TSLA is moving in sideways directions. Don't get confused with too many lines. S1, S2 and S3 represent three Support Levels (Green Lines). R1, R2, and R3 represent three Resistance Levels (Red Lines). Place these levels (orders) simultaneously, when one order type is filled cancel the other one. Make sure these orders are Buy Stop and Sell Stop Orders. Take Profit levels are defined with Yellow Lines. The risk-reward ratio is always 1:2. Comment if there's a query

Sideway Movements for NASDAQ:TSLA by ShahzaibNaveed
TSLA is moving in sideways directions. Don't get confused with too many lines. S1, S2 and S3 represent three Support Levels (Green Lines). R1, R2, and R3 represent three Resistance Levels (Red Lines). Place these levels (orders) simultaneously, when one order type is filled cancel the other one. Make sure these orders are Buy Stop…
Shares:

