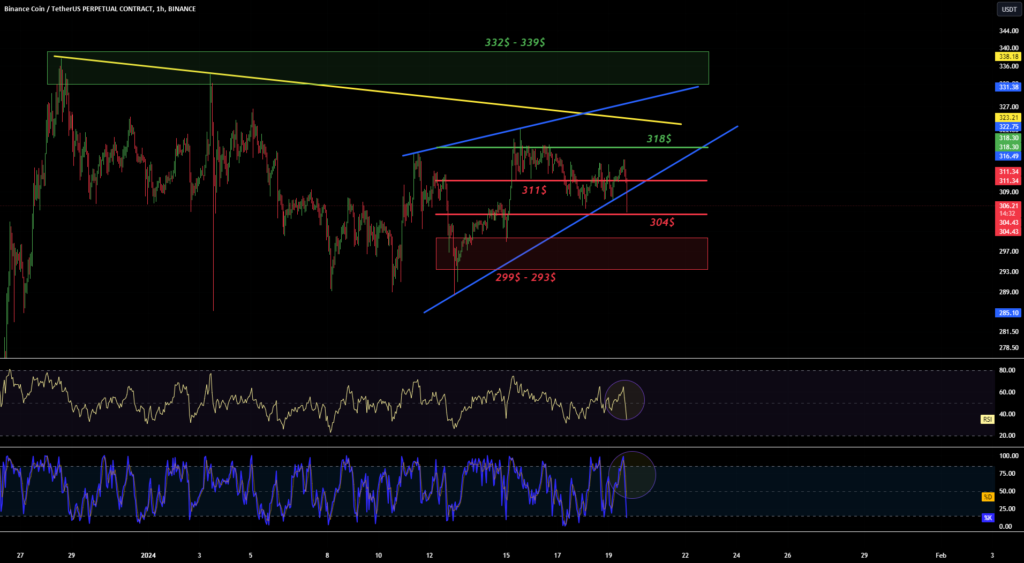
I invite you to review the BNB chart. And here we can start by defining the downtrend line with the yellow line, then we can use the blue color to mark the upward trend channel in which the price moves at the lower border. Let's now move on to the trend based fib extension grid, thanks to which we can see how the price is struggling with the support at $311, after breaking out from the bottom we can see support at the price of $304, and the support zone from $299 to $293 will be more …

BNB/USDT 1HInterval Chart for BINANCE:BNBUSDT
I invite you to review the BNB chart. And here we can start by defining the downtrend line with the yellow line, then we can use the blue color to mark the upward trend channel in which the price moves at the lower border. Let's now move on to the trend based fib extension grid,…
Shares:

