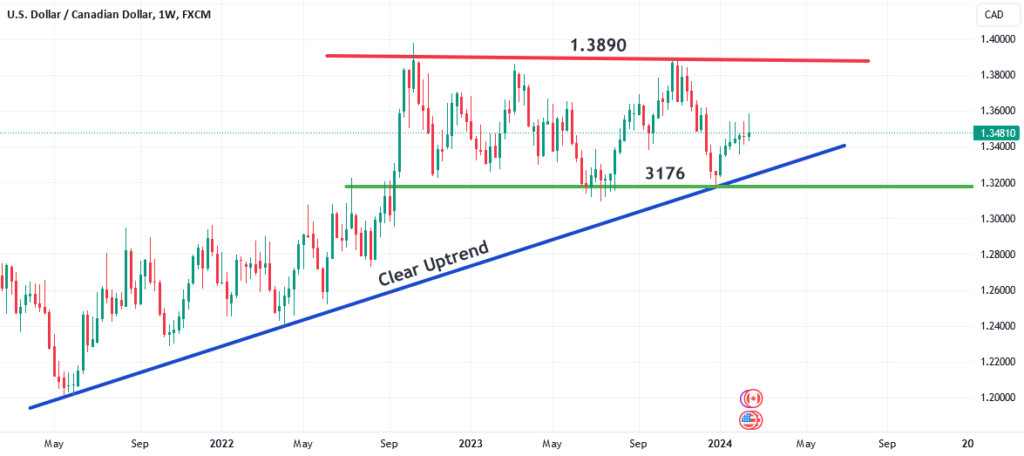
#USDCAD FX:USDCAD ️ Date: 18 February, 2024 ⏰ Time frame: Weekly Given in the chart – ️ Blue Color (Long Term Trend line) = Strong Uptrend Weekly, H4 ️ Red Color (Range) Resistance = 1.3894 ️ Green Color (Support Zone) = 1.3176 This is the weekly time frame chart of the currency pair. First, notice that on the chart you can see a trend line (black color) line above which the price is currently positioned. Price touches this trend line multiple times and bounces upwards ie, the …

USDCAD Clear Uptrend for FX:USDCAD by GreenFxTrading
#USDCAD FX:USDCAD ️ Date: 18 February, 2024 ⏰ Time frame: Weekly Given in the chart – ️ Blue Color (Long Term Trend line) = Strong Uptrend Weekly, H4 ️ Red Color (Range) Resistance = 1.3894 ️ Green Color (Support Zone) = 1.3176 This is the weekly time frame chart of the currency pair. First, notice…
Shares:

