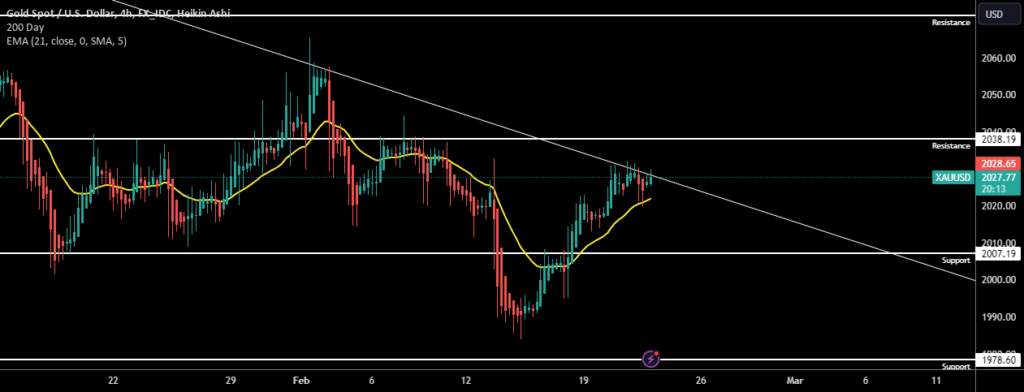
Hey Traders, Check out gold price chart with the cool Heikin Ashi candles. Right now, gold's kinda stuck between two key lines: the blue line (200-day average) is like a safety net below, and the yellow line (21-day average) is a tricky ceiling it's trying to break through. We've got some green candles showing up, which means buyers are trying to push the price up. If they keep it up and the price stays above the yellow line, we could see it go higher, aiming for the resistance level at …

XAUUSD “Golden Opportunity” for FX_IDC:XAUUSD by SheenaL
Hey Traders, Check out gold price chart with the cool Heikin Ashi candles. Right now, gold's kinda stuck between two key lines: the blue line (200-day average) is like a safety net below, and the yellow line (21-day average) is a tricky ceiling it's trying to break through. We've got some green candles showing up,…
Shares:

