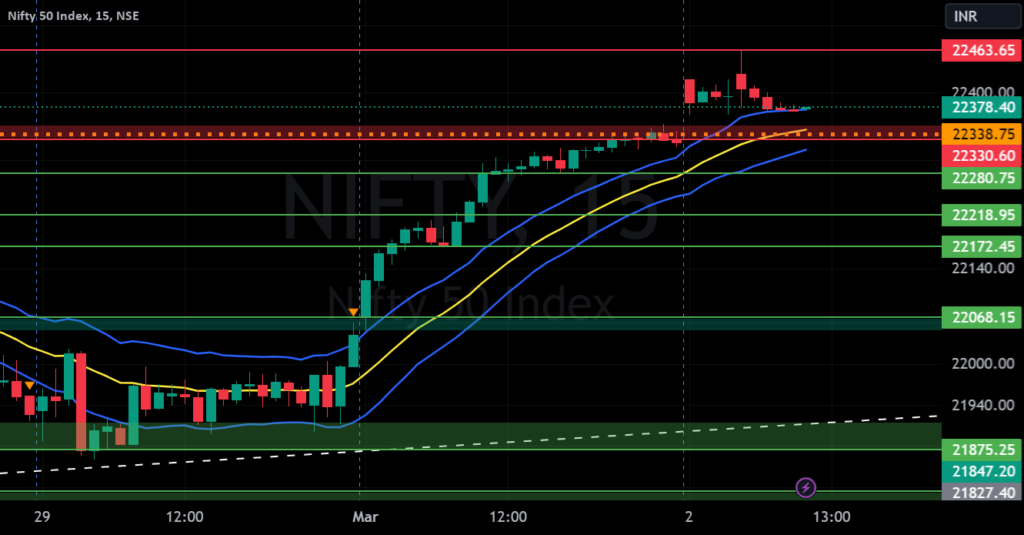
Support and Resistance Levels: Based on the price action, you have to identify two significant levels: the red line acting as resistance and the green line acting as support. Additionally, there have marked red and green shades to represent resistance and support zones, respectively. Support: The green line and green shade represent support levels. These levels are where the price tends to find buying interest, preventing it from falling further. Traders can consider these levels as potential …

NIFTY S/R for 4/3/24 for NSE:NIFTY by zenthosh
Support and Resistance Levels: Based on the price action, you have to identify two significant levels: the red line acting as resistance and the green line acting as support. Additionally, there have marked red and green shades to represent resistance and support zones, respectively. Support: The green line and green shade represent support levels. These…
Shares:

