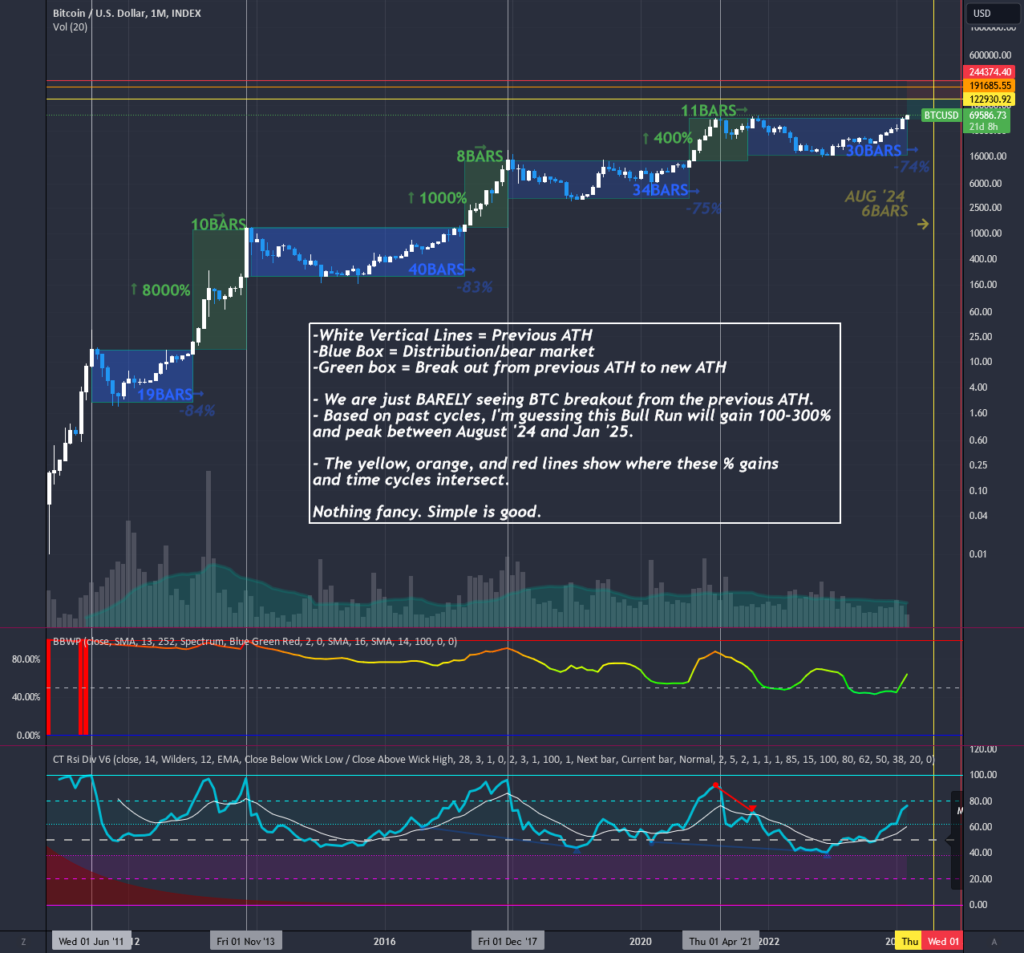
-White Vertical Lines = Previous ATH -Blue Box = Distribution/bear market -Green box = Break out from previous ATH to new ATH – We are just BARELY seeing BTC breakout from the previous ATH. – Based on past cycles, I'm guessing this Bull Run will gain 100-300% and peak between August '24 and Jan '25. – The yellow, orange, and red lines show where these % gains and time cycles intersect. Nothing fancy. Simple is good.

BTC M for INDEX:BTCUSD by A_No-1
-White Vertical Lines = Previous ATH -Blue Box = Distribution/bear market -Green box = Break out from previous ATH to new ATH - We are just BARELY seeing BTC breakout from the previous ATH. - Based on past cycles, I'm guessing this Bull Run will gain 100-300% and peak between August '24 and Jan '25.…
Shares:

