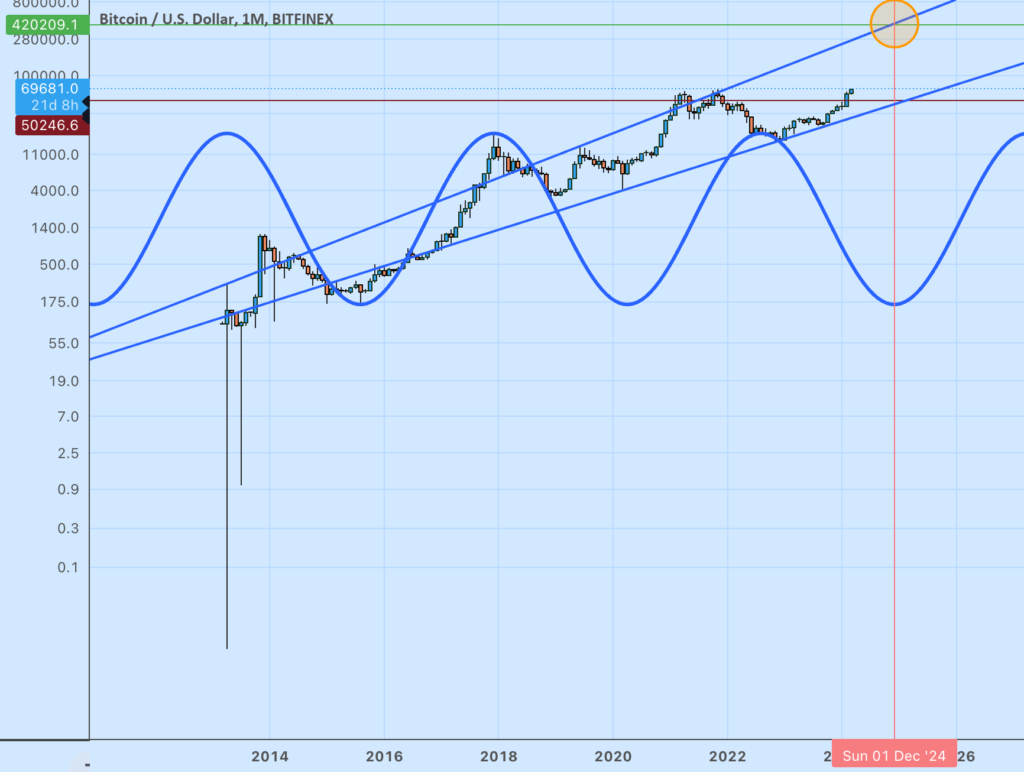
Delving into the technical intricacies, this extended monthly BTC/USD chart meticulously plots Bitcoin's valuation against the U.S. Dollar with a key focus on Bitfinex's exchange data. It goes beyond mere historical analysis, incorporating a mathematical model with a sine wave overlay that suggests potential cyclicality in Bitcoin's market behavior. This blue sine wave, oscillating with Bitcoin's price data, intimates at possible time cycles which seasoned chartists often seek to decode, …

BTC Bull Cycle Hopeful Outcome for BITFINEX:BTCUSD by aaronkaltman
Delving into the technical intricacies, this extended monthly BTC/USD chart meticulously plots Bitcoin's valuation against the U.S. Dollar with a key focus on Bitfinex's exchange data. It goes beyond mere historical analysis, incorporating a mathematical model with a sine wave overlay that suggests potential cyclicality in Bitcoin's market behavior. This blue sine wave, oscillating with…
Shares:

