Hello, traders.
If you “Follow”, you can always get new information quickly.
Please click “Boost” as well.
Have a nice day today.
————————————-
(1M chart)

–
(1W chart)

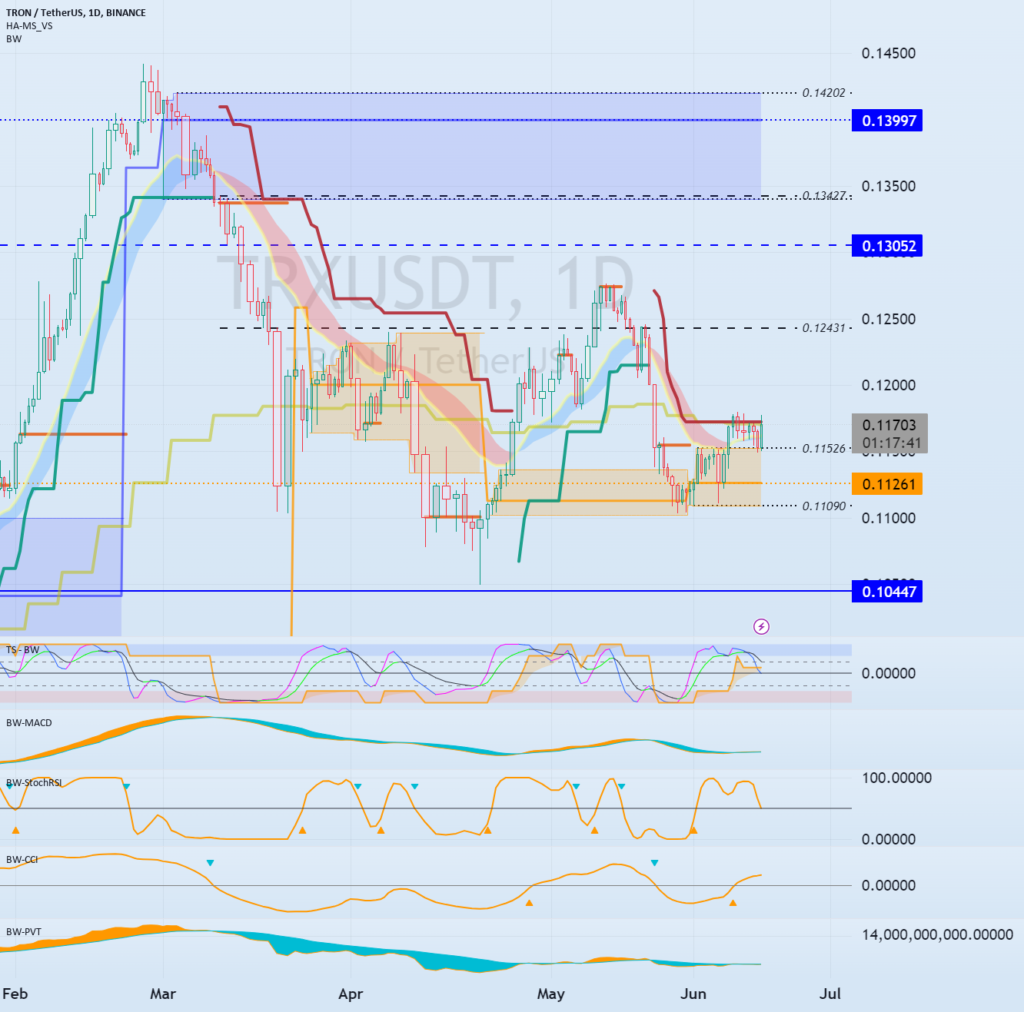
The current medium- to long-term trend is maintaining an uptrend, but if it falls below 0.10447, it is judged that it is likely to turn into a downtrend.
–
(1D chart)

If not, you should check for support near the box section of the HA-Low indicator on the 1D chart.

The key is whether the price can be formed by maintaining the bottom section near the HA-Low indicator on the 1D chart.
–
Have a good time.
Thank you.
————————————————–
– Big picture

The section that is expected to be touched in the next bull market is 81K-95K.
#BTCUSD 12M

2nd: 61383.23
3rd: 89126.41
101875.70-106275.10 (overshooting)
4th: 13401.28
151166.97-157451.83 (overshooting)
5th: 178910.15
These are points where resistance is likely to occur in the future.
We need to check if these points can be broken upward.
We need to check the movement when this section is touched because I think a new trend can be created in the overshooting section.
#BTCUSD 1M

1st: 43833.05
2nd: 32992.55
—————–


