Hello my fellow cryptocurrency traders, we have some similarities with the past and present day. Let’s have a look at this simple signal: volume.
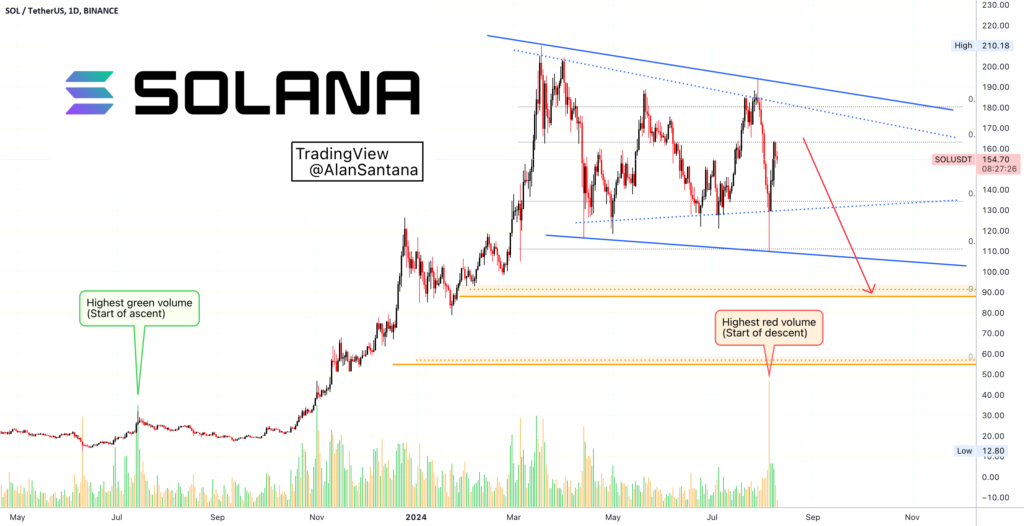
In July 2023 (left side of the chart —green), Solana (SOLUSDT) produced a very strong signal in the form of bullish volume. The strong buy volume came after more than 45 days of bullish action.
The strong buy volume signaled the start of a major bullish wave.
In August 2024 (right side of the chart —red), Solana (SOLUSDT) produced a very strong signal in the form of bearish volume. The strong sell volume came after more 140 days of bearish action.
The strong sell volume signaled… the continuation of a bearish move?
What do you make of this signal?
Do you think this signal indicates a bullish reversal or bearish continuation?
Share in the comments section below.
Namaste.


