

Hello, traders.
If you “Follow”, you can always get new information quickly.
Please also click “Boost”.
Have a nice day today.
————————————-
(Renko 1D chart)
Among altcoins, the number of coins showing upward movement as above is increasing.
In order for a block to be completed, it must rise by more than a block unit.
In the chart above, the rising block is completed only if it rises by more than 5.2.
Otherwise, if it falls below 4.8, the rising block disappears.
In this way, the Renko chart can be said to be a suitable chart for checking trends.
–
(SOLUSDT Renko 1D chart)
——————————————-
(SOLUSDT 1M chart)
(1W chart)
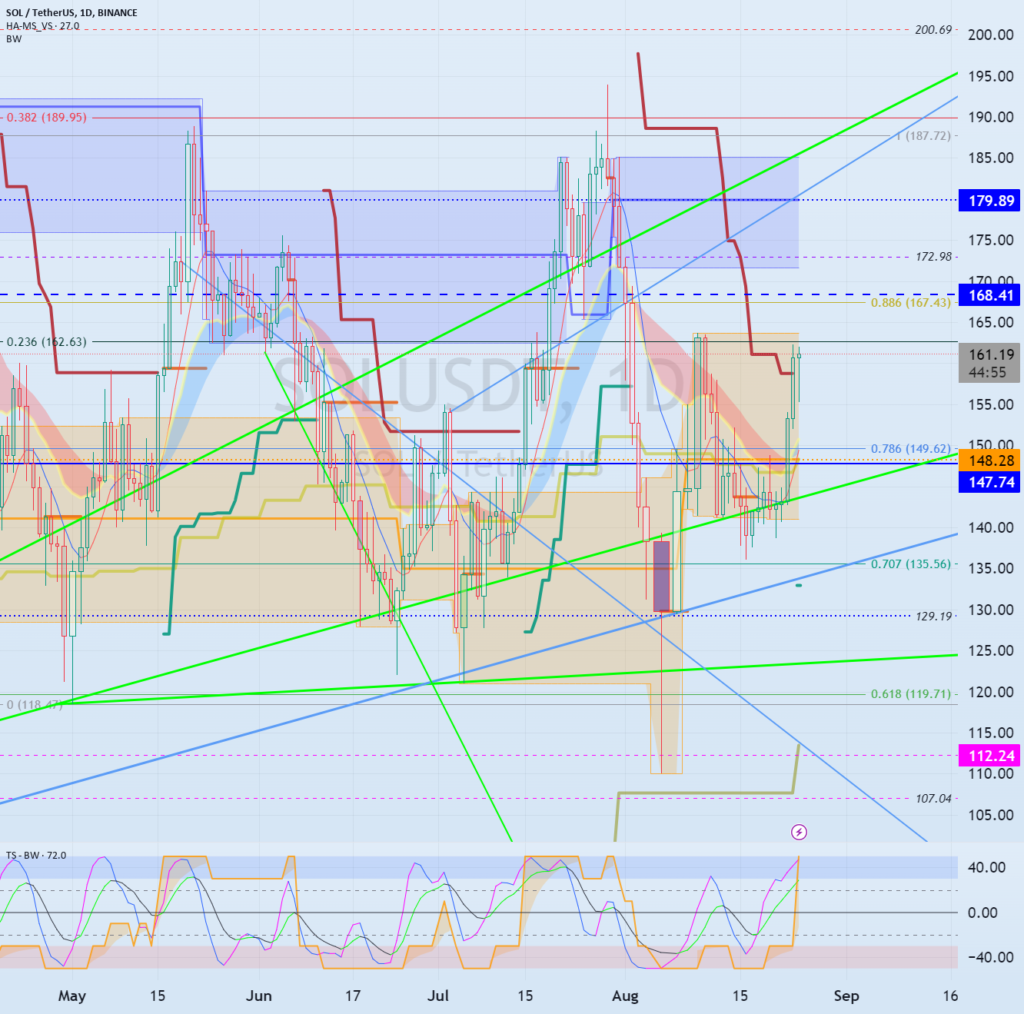
(1D chart)
If you look at the 1M, 1W, and 1D charts above, you can see that the 147.74, 168.41, and 179.89 points are important.
Therefore, if it fails to rise above 168.41, it is important to find support near 147.74.
–
Due to this rise, it seems that the M-Signal of the 1D chart > M-Signal of the 1W chart > M-Signal of the 1M chart has changed.
Therefore, this time, it is important to see whether it can be supported near 147.74 and rise above 179.89.
–
Accordingly, it is a buying period depending on whether it is supported near 147.74, 168.41, and 179.89.
The stop loss point is the HA-Low indicator.
The current HA-Low indicator points are
1M: Not yet created
1W: 13.81
1D: 148.28
as above.
Since the HA-High and HA-Low indicators are created according to price fluctuations, it is recommended to check the 1M, 1W, and 1D charts together.
–
Have a good time.
Thank you.
————————————————–
– Big picture
It is expected that the real uptrend will start after rising above 29K.
The section expected to be touched in the next bull market is 81K-95K.
#BTCUSD 12M
1st: 44234.54
2nd: 61383.23
3rd: 89126.41
101875.70-106275.10 (when overshooting)
4th: 13401.28
151166.97-157451.83 (when overshooting)
5th: 178910.15
These are points where resistance is likely to occur in the future.
We need to check if these points can be broken upward.
Since I think it can create a new trend in the overshooting section, I need to check the movement when this section is touched.
#BTCUSD 1M
If the major uptrend continues until 2025, it is expected to create a pull back pattern and start after rising to around 57014.33.
1st: 43833.05
2nd: 32992.55
—————–