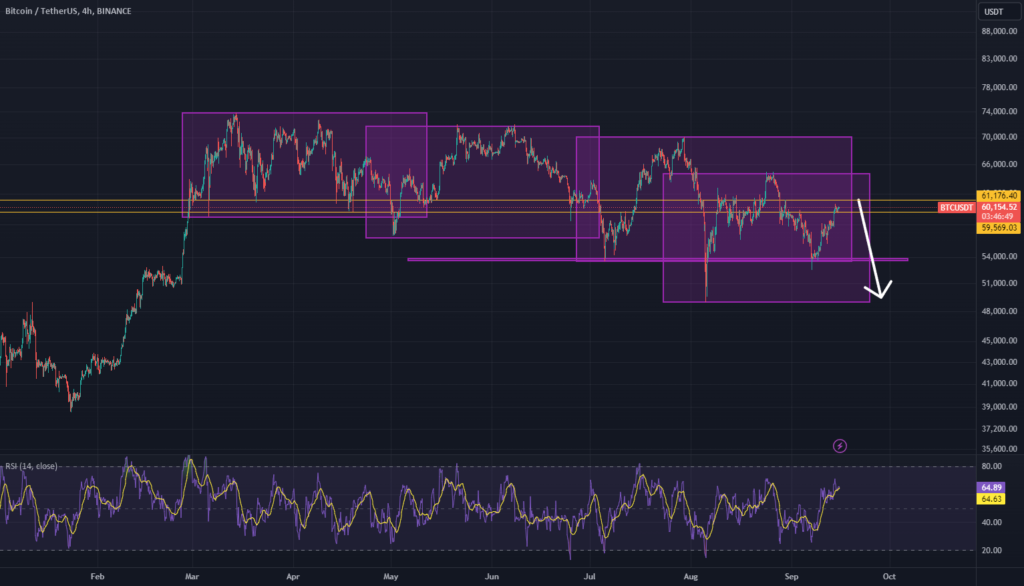
Looking at the chart for **Bitcoin (BTC/USDT)**, here’s a breakdown of the analysis:
### 1. **Market Structure:**
The chart shows a series of **consolidation ranges**, marked by the purple boxes, with the price moving between these ranges over time. These ranges suggest that the market is in a sideways, ranging phase, with clear support and resistance levels being respected.
### 2. **Key Levels:**
– **Resistance Level (around 61,176 USDT):** Bitcoin is currently near a resistance zone, and from the recent history of the price movement, this level has acted as a barrier multiple times.
– **Support Level (around 59,569 USDT):** The price has bounced off this level a few times as well, and it seems to be a significant support zone in the current market.
### 3. **RSI Indicator:**
The RSI is hovering around **64**, which is approaching overbought territory but is not quite there yet. This suggests that the price could still move upward a bit before the market considers it overbought, but caution is warranted as a reversal could happen.
### 4. **Trade Plan:**
– Based on the current structure, you seem to be expecting a **rejection from the resistance** level near 61,176 USDT.
– The **downward arrow** in the chart indicates that you’re anticipating a sell-off or correction once Bitcoin reaches this resistance zone, with the price potentially moving toward the next support area.
### 5. **Potential Targets:**
– **Short-Term Target:** You may expect the price to drop back to the 59,569 USDT level initially, which is the nearest support zone.
– **Longer-Term Target:** If the price breaks through this support level, the next target could be around 54,000 USDT, as indicated by the lower support zone.
### 6. **Conclusion:**
This trade idea appears to be a **sell setup**:
– **Sell near resistance (61,176 USDT)** if a rejection occurs.
– **First target** at **59,569 USDT** (support).
– If the price breaks lower, you could look for a **further decline toward 54,000 USDT**.
This setup follows a classic range-bound trading strategy where the price is expected to reverse at resistance and head toward the nearest support level. Monitoring the RSI and price action around these key levels will be crucial for timing the entry and exit of the trade.


