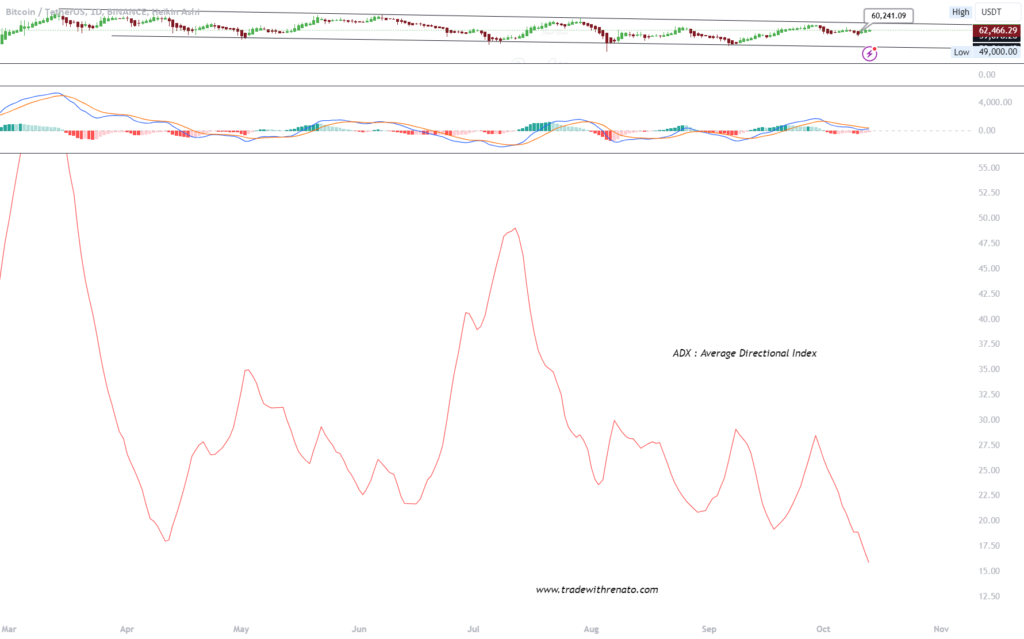
ADX (Average Directional Index) ADX is an excellent indicator for measuring the strength of a trend. It does not indicate the direction (up or down), but when combined with other indicators, it helps identify when a trend is strong enough to warrant a trade. It is most effective for use on time frames that depend on your trading style, such as 5- to 30-minute charts for day traders or daily charts for long-term investors.
It was created by J. Welles Wilder and is used to assess whether the market is in a strong or weak trend, helping traders avoid trading in sideways markets (without a clear trend).
ADX is derived from two other indicators: +DI (positive Directional Indicator) and -DI (negative Directional Indicator), which measure the strength of upward and downward movements, respectively. ADX, which is the average value of the two, indicates the strength of the trend.
ADX above 25: Indicates a strong trend.
ADX below 20 or 25: Indicates a weak trend or a sideways market.
Identifying Trend Strength:
A high ADX (above 25-30) indicates a strong trend. The higher the value, the stronger the trend, whether up or down.
A low ADX (below 20-25) suggests that the market is trendless (sideways), which may indicate that it is best to avoid trading in a particular direction.
Confirming Trends:
If the ADX is rising while the price is rising or falling, this confirms that the trend is strong.
If the ADX is falling, this suggests that the trend is losing strength, even if the price continues to rise or fall.
Avoiding False Signals:
When the ADX is below 25, it is more difficult to identify clear trends, and there is a greater risk of entering false breakouts.
ADX is useful for avoiding trades in markets without a clear direction, where movements can be very volatile or erratic.
ADX can be used on different time frames, but its effectiveness varies depending on the trading style. The most common time frames are:
Day Traders: Use ADX on 5, 15 or 30 minute charts, seeking to confirm the strength of intraday trends.
Swing Traders: Prefer 4-hour or daily charts to identify the strength of medium-term trends.
Position Traders: Generally use daily or weekly charts, analyzing long-term trends based on ADX.


