

8 hours ago
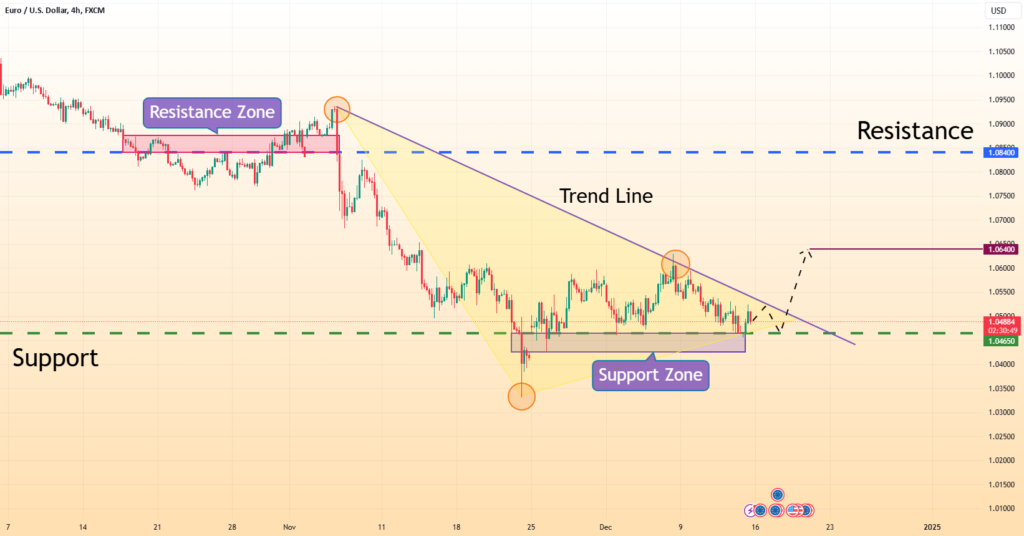
If we look at the chart, we can see how the price fell to the resistance level, coinciding with the resistance zone, and even broke through it and broke through it. Then, the euro fell below this level for a while, then went higher, broke through this level again and reached the trend line, after which there was a downward impulse and broke through the 1.0840 level again. Similarly, the price continued to fall within the descending pennant and fell to the support level after a while, coinciding with the support zone. Later, the euro fell below this level and fell to the support line of the pennant, then rebounded and broke through the 1.0465 level again, also with a gap. Next, the price retested the support level, then traded around this level for a while, after which it rebounded to the trend line, which is also the resistance line of the pennant. After this, it turned around and fell to the support level. For this case, I expect EUR/USD to reach the trend line, then correct to the support level, and then start to rise, thus exiting the pennant pattern. When the price leaves the pattern, it can continue to rise, so I set the target at 1.0640 points.
Chart PatternsHarmonic PatternsTrend Analysis