
I’m always looking for signs of a change in trend direction.
A good indicator has always been;
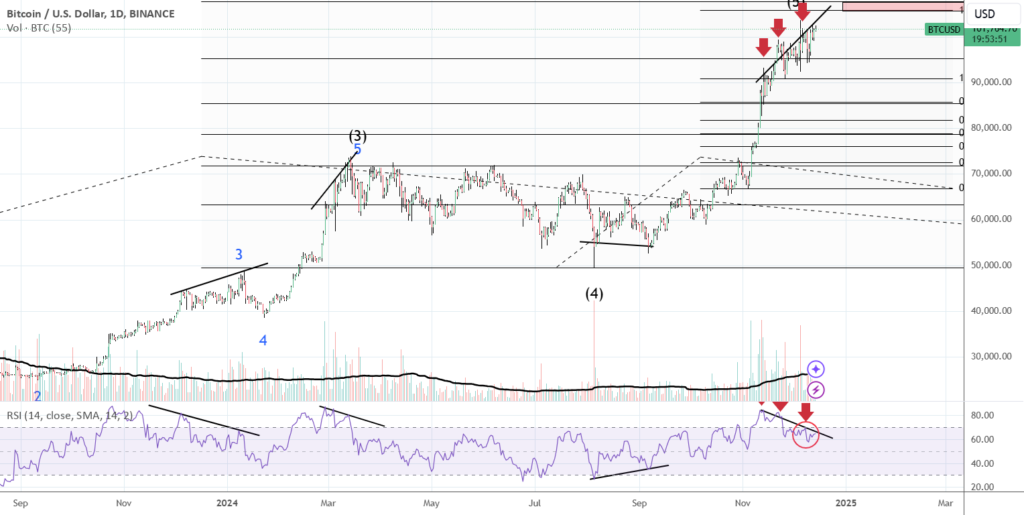
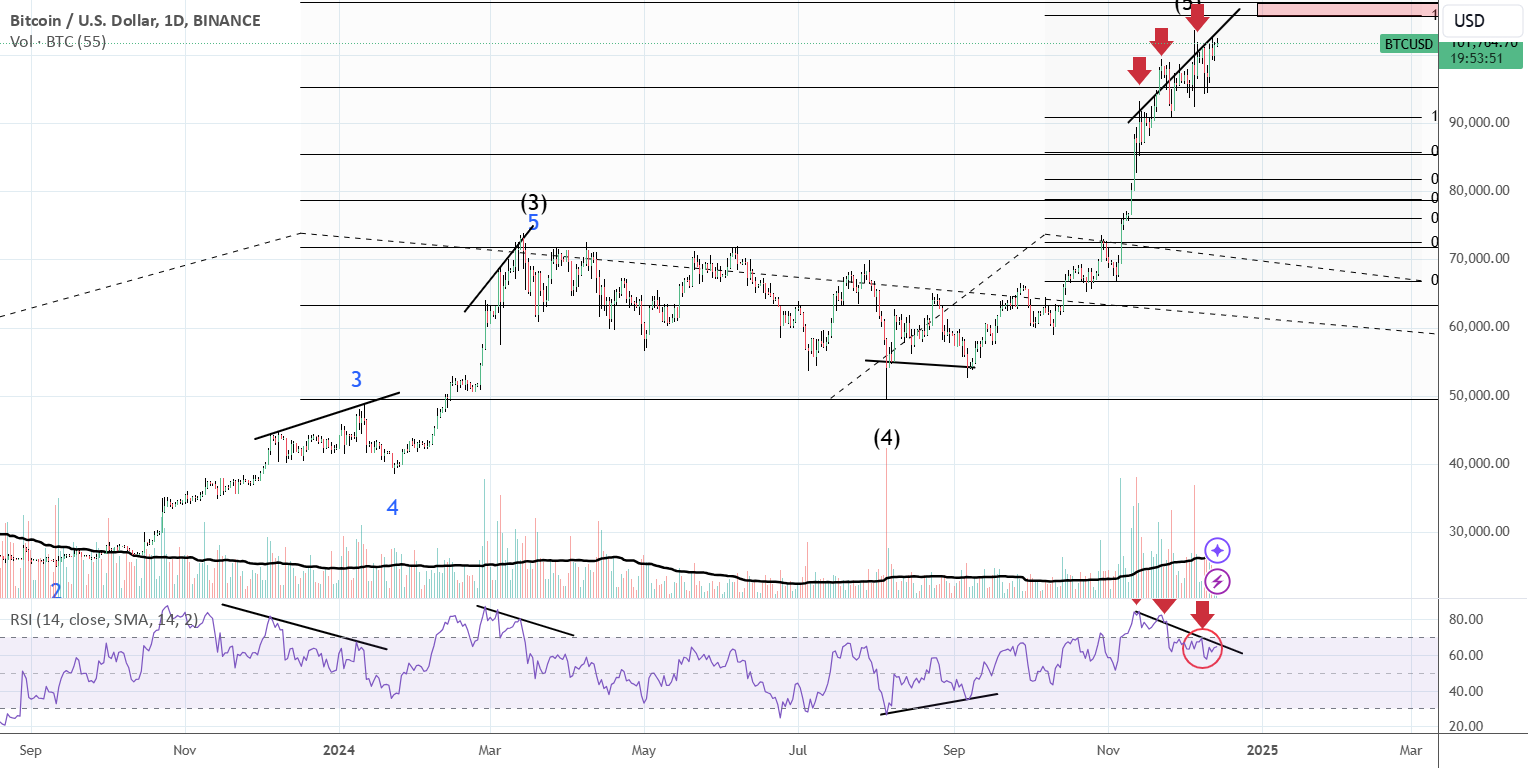
1. A series of higher highs in the price-action, with
2. A corresponding series of lower highs on the RSI (for major trend changes or corrections I use the daily time-frame),
3. Ideally, three lower highs on RSI (sometimes you only get two), with the final RSI high FAILING to get above the 70 level of RSI (red circle).
To me this signals – at a minimum – a correction is inbound. So, I would look for other indicators to determine if I think if it is a correction or a trend-change i.e. bear market.
There is a plausible Elliot Wave count. Without getting too technical, I see the 105 to 108k as the end of the trend. Could be wrong, could be right. If I am right I should get a medal for accuracy. Happy trading.