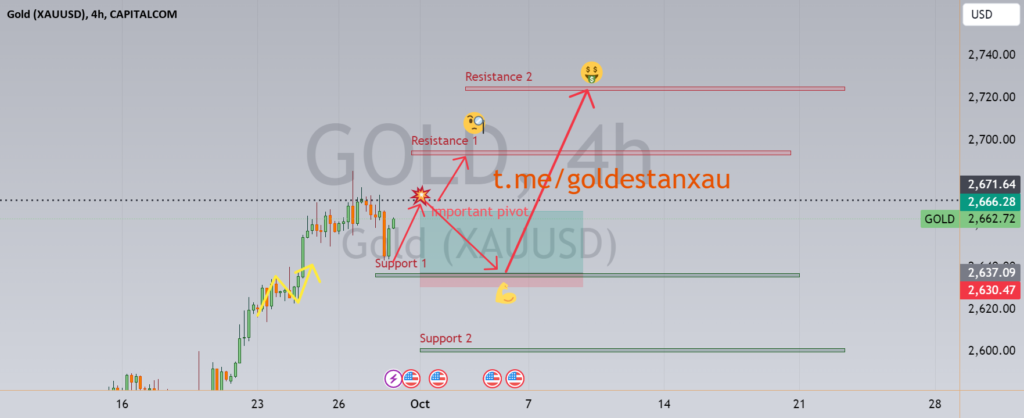
This chart represents a 4-hour analysis of the gold (XAUUSD) price, highlighting key support and resistance levels. The resistance points are marked at 2720 and 2740, labeled as “Resistance 1” and “Resistance 2” respectively. An important pivot is located between these levels, acting as a key area for decision-making.
On the other hand, support levels are identified at 2630 and 2600, marked as “Support 1” and “Support 2.” These points indicate potential zones where the price might react if it drops, possibly resuming an upward movement.
Based on this analysis, for trading decisions, if the price nears the support levels (2630 and 2600), it could be a buying opportunity. Conversely, if the price approaches the resistance levels (2720 and 2740), it might be a good time to consider selling.


