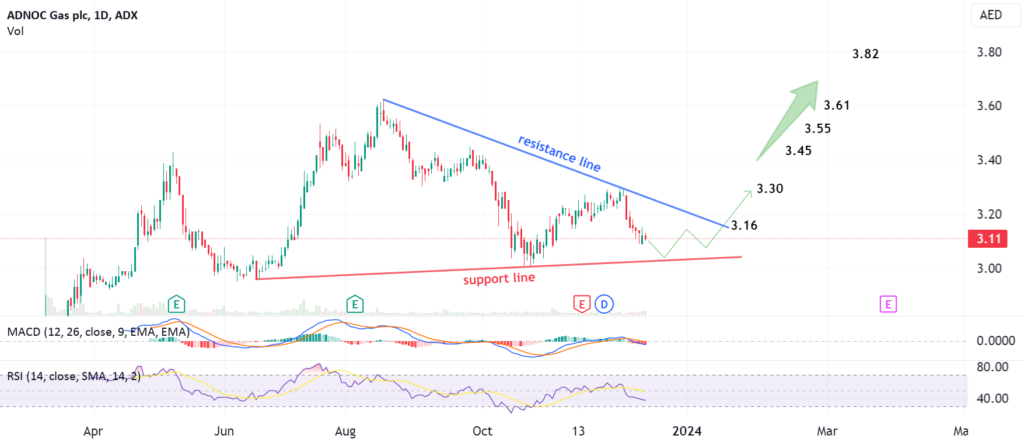
Daily chart, the stock ADNOC GAS is trading between support and resistance lines since mid June 2023. A Triangle chart pattern is being formed – After the price clearly crosses the resistance line (BLUE), around 3.15 – 3.16, then the target will be 3.82, passing through some resistance levels as shown on the chart. ENTRY #1: BUY at touching the support line (RED) around 3.02 – 3.03 and rebounding. Stop Loss below 3.00 ENTRY #2: BUY after clear crossing of resistance line (closing 2 days …

ADNOC GAS (ADX), to target 3
Daily chart, the stock ADNOC GAS is trading between support and resistance lines since mid June 2023. A Triangle chart pattern is being formed - After the price clearly crosses the resistance line (BLUE), around 3.15 - 3.16, then the target will be 3.82, passing through some resistance levels as shown on the chart. ENTRY…
Shares:

