Introduction:
Oil prices have been on a volatile journey, especially after a significant 5-wave decline. As markets react to geopolitical and economic factors, technical analysis can provide a clearer picture of potential price movements. This analysis focuses on the recent price action and key levels in the daily and 4-hour timeframes to anticipate future trends.
Daily Timeframe:
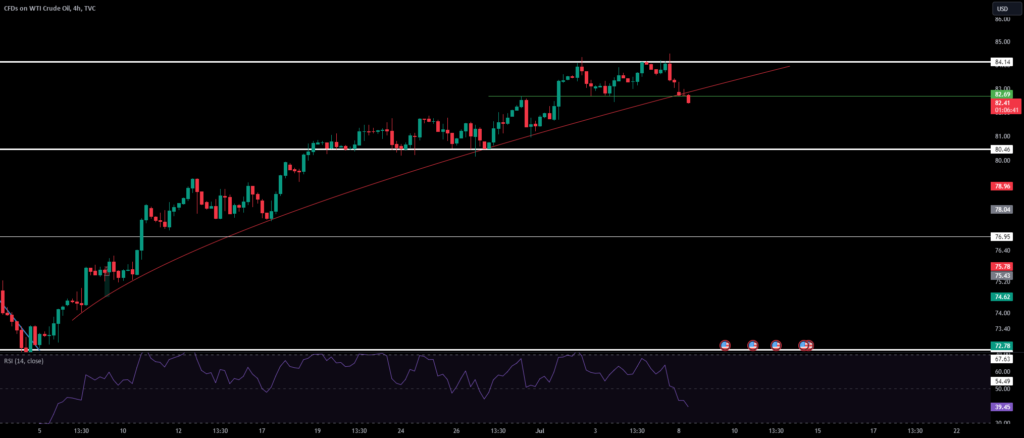
After a 5-wave decline, the price started a strong upward trend from $72.6. Over time, the strength and momentum of this wave decreased, as confirmed by the smaller green candles along the way and increased rest periods before each downward move. The $84 supply zone is the main resistance for oil in 2024. Yesterday’s candle was a rejection candle from this area, engulfing the two previous green candles.

The upward curving line has been broken, and if a candle closes below $82.5, the price could potentially correct down to $80.45. The RSI has lost the important support level of 50, indicating the end of upward momentum and the entry of sellers into the market. Additionally, the double top candlestick pattern is clearly visible, targeting around $80.
If the price manages to close a 4-hour candle above $84.14, this would indicate the continuation of the upward trend, and buying positions can be considered.
Key Levels to Watch:
• Daily Resistance: $84
• Potential Correction Target: $80.45
• Bullish Continuation Level: $84.14
Indicators:
• RSI: Lost support at 50
• Candlestick Patterns: Double top
Market Sentiment:
• A close below $82.5 on the 4-hour timeframe suggests bearish momentum.
• A close above $84.14 on the 4-hour timeframe suggests bullish continuation.
Conclusion:
Oil prices are at a critical juncture. The rejection from the $84 resistance and the loss of momentum signal a potential bearish correction. However, a confirmed close above $84.14 on the 4-hour timeframe could reignite bullish momentum. Traders should watch these key levels closely to make informed decisions.
________________________________________
️ Disclaimer: This is not financial advice. Please do your own research before making any trading decisions.

Assessing Oil’s Technicals: Is Bullish Momentum on the Wane? for
Introduction: Oil prices have been on a volatile journey, especially after a significant 5-wave decline. As markets react to geopolitical and economic factors, technical analysis can provide a clearer picture of potential price movements. This analysis focuses on the recent price action and key levels in the daily and 4-hour timeframes to anticipate future trends.…
Shares:

