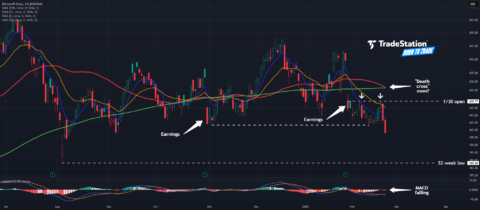
Microsoft has sputtered for months, and now some traders may see downside risk.The first pattern on today’s chart is the pair of bearish gaps after earnings. The software giant rebounded
Current Market Structure:ETH/USD has been consolidating within a well-defined range since early February.The support zone is around $2,400 - $2,450, while the resistance zone is between $2,800 - $2,900.A clear
Optimal Trading Zones for Buying and SellingRecommended Selling Zones:Primary Selling Zone: 48,950 – 49,050Secondary Selling Zone: 48,900 – 48,666When the price reaches these levels, it's a good opportunity to consider
Come here the final chapter and the major analysis (thorough on trumpusdt) [READ ALL CAREFULLY]https://www.tradingview.com/chart/TRUMPUSDT/OajCznW7-DId-you-trap-the-sellers-or-you-again-got-trapped-TRUMPUSDT/Here i drew this, the above image. where you can see two red boxes followed by
Sell after bearish candle stick pattern, buy after bullish candle stick pattern....Best bullish pattern , engulfing candle or green hammerBest bearish pattern , engulfing candle or red shooting starNOTE: IF
For people who follow me for a while, know that I'm bullish on HBAR as it's simply the most secure, fastest, cheapest and most energy efficient Layer 1 in the
This morning, the VIX popped to $19.26, not seeing levels like this since the Jan. 27th, 2025 jump to $19.93, where the SPY saw an almost 3% drop, NASDAQ dropped
Hello dear traders! Do you think XAUUSD should be bought or sold?Yesterday, after reaching 2,945 USD/ounce, the gold price in the trading session last night was sold by some investors,
AUD/USD news:The Australian dollar climbed to 0.6370 on Monday following China’s release of its 2025 annual policy statement on Sunday. The statement outlined plans to advance rural reforms and drive
24/02/2025HSI took off like a rocket… then remembered it forgot its wallet and came back for a quick retrace!" Next target : 24385HSI 1W ChartLook at that! ignore the news,