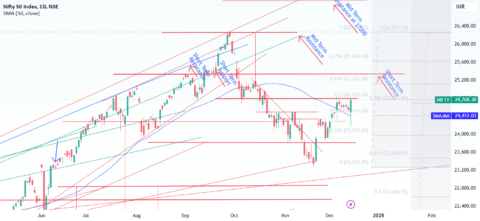
Nifty Short, Medium & Long Term : 16-Dec-24 to 20-Dec-24Nifty closed at 24677 (last week 4276) , for last 30-40 days nifty was in sideways movement. last week on the
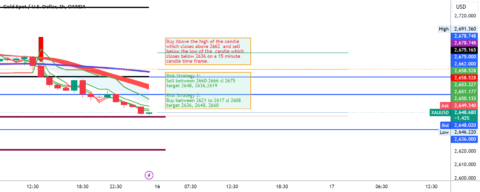
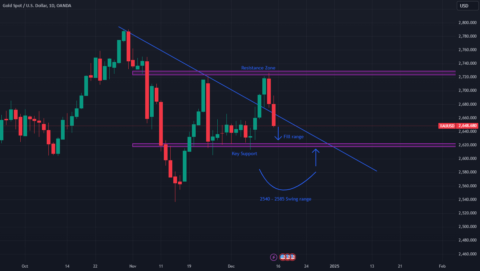
Gold Trading StrategyBuy Above: The high of the candle which closes above 2662 on a 15-minute chartSell Below: The low of the candle which closes below 2636 on a 15-minute
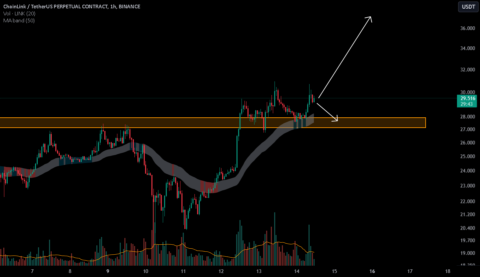
Key Level Zone : 27.10-27.91HMT v1.0 detected. The setup looks promising, supported by a previous upward/downward trend with increasing volume and momentum, presenting an excellent reward-to-risk opportunity.HMT (High Momentum Trending):HMT
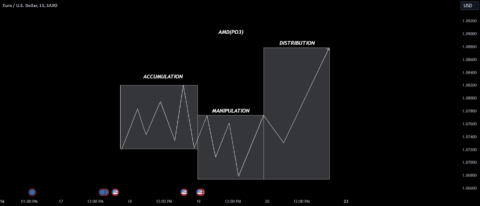
yesterday1. AccumulationWhat Happens?Smart money (institutions) accumulates large positions quietly, ensuring they don’t move the market significantly.This occurs in a range-bound phase (consolidation) where prices trade within support and resistance levels.How
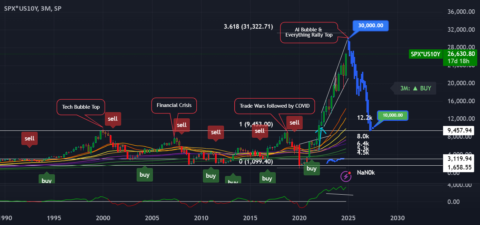
1. Combining Equity Levels and Yield SensitivitySPX (S&P 500) reflects equity market strength and investor sentiment. When SPX is rising, it typically indicates optimism or strong earnings growth expectations.US10Y (10-year
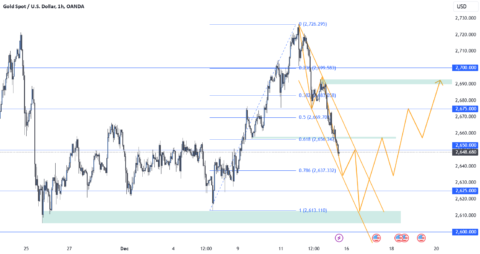
Based on the daily timeframe. Trendline Break and Retest: Gold broke a descending trendline but made a false breakout, returning into the range. This indicates indecision or a lack of
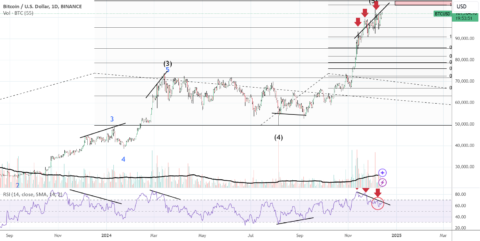
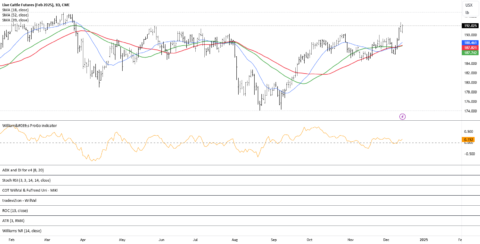
I'm always looking for signs of a change in trend direction.A good indicator has always been;1. A series of higher highs in the price-action, with2. A corresponding series of lower
Decoding the Signals: Is the Live Cattle Market Poised for a Bearish Shift?“There is a system in chaos, a signal in the noise.”Every week, the Commitment of Traders (COT) strategy
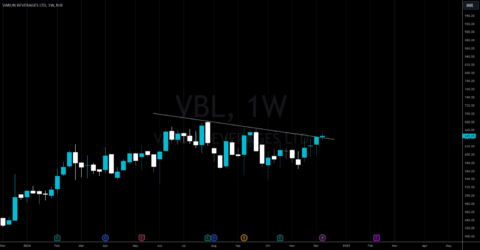
Checkout an amazing breakout happened in the stock in Weekly timeframe, macroscopically seen in Daily timeframe. Having a great favor that the stock might be bullish expecting a staggering returns