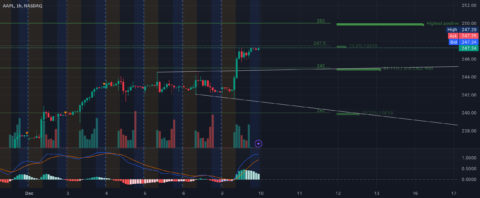
Price Action:* Opening Movement: At market open, AAPL exhibited a strong upward momentum, driven by sustained buying pressure, pushing the price above key resistance levels.* Mid-Day: Consolidation occurred around the
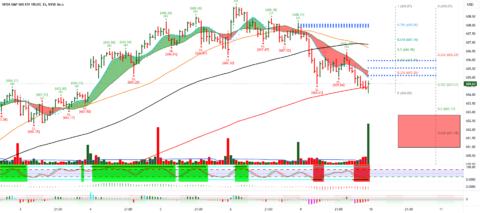
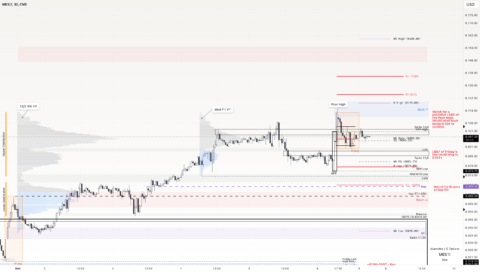
SPY December 10, 202415 Minutes.605 as expected was done.Downtrend confirmed as long SPY is below 607 levels.607 is 200 averages in 5 minutes and 61.8% retracement for the fall 609.07
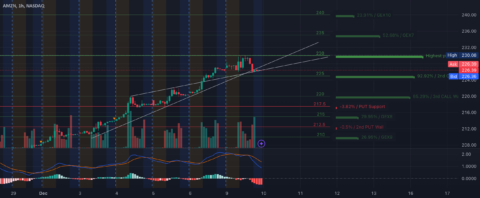
Technical Analysis for AMZN (Dec. 10, 2024)Price Action:* Opening Movement: AMZN opened with bullish momentum, continuing its trend from the previous session. It tested the $230 resistance level, coinciding with
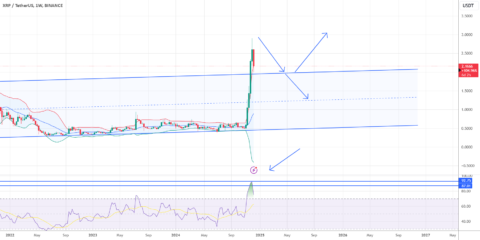
15 minutes agoHello friends, the market situation is very beautiful and clean, I remind you that in my previous idea, I predicted the market to fall, and the market continued
We continue OTFU on the weekly and daily. I want to be slightly cautious above here, not because it's bearish, but simply because we're above a 2 sigma deviation (SPX
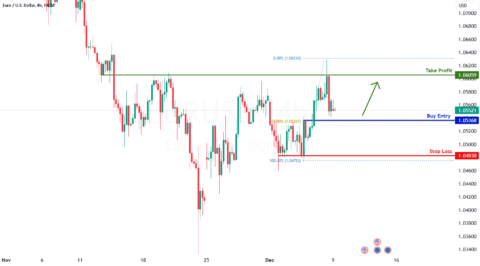
Based on the H4 chart analysis, we can see that the price is falling to our buy entry at 1.0536, which is a pullback support that aligns with 61.8% Fibo
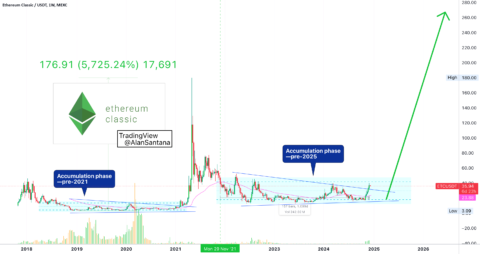
The longer the accumulation phase, the stronger the bull-market that follows... Good evening my fellow trader, you are great for reading this now and I would like to thank you.This
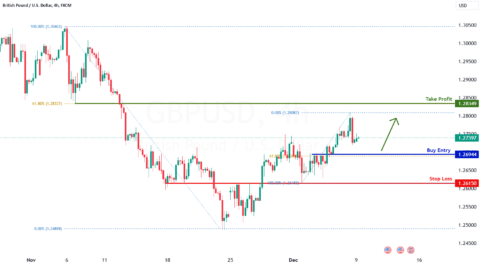
Based on the H4 chart analysis, we can see that the price is falling to our buy entry at 1.2694, which is an overlap support that aligns with 61.8% Fibo
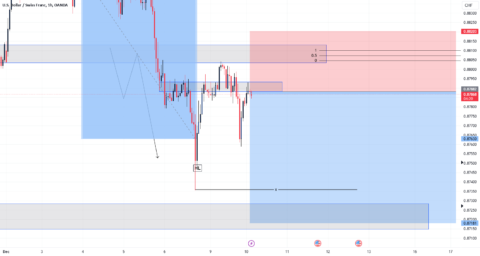
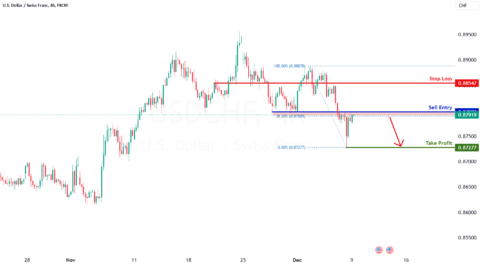
Based on the H4 chart analysis, we can see that the price is approaching our sell entry at 0.8798, which is a pullback resistance close to 38.2% Fibonacci retracement.Our take