The Disciplined Trader How to Enter the Chart for Intraday Trading:1. Identify Candle Closure:○ Look for a candle to cross your predetermined zone and close beyond it.2. Validate the Break:○
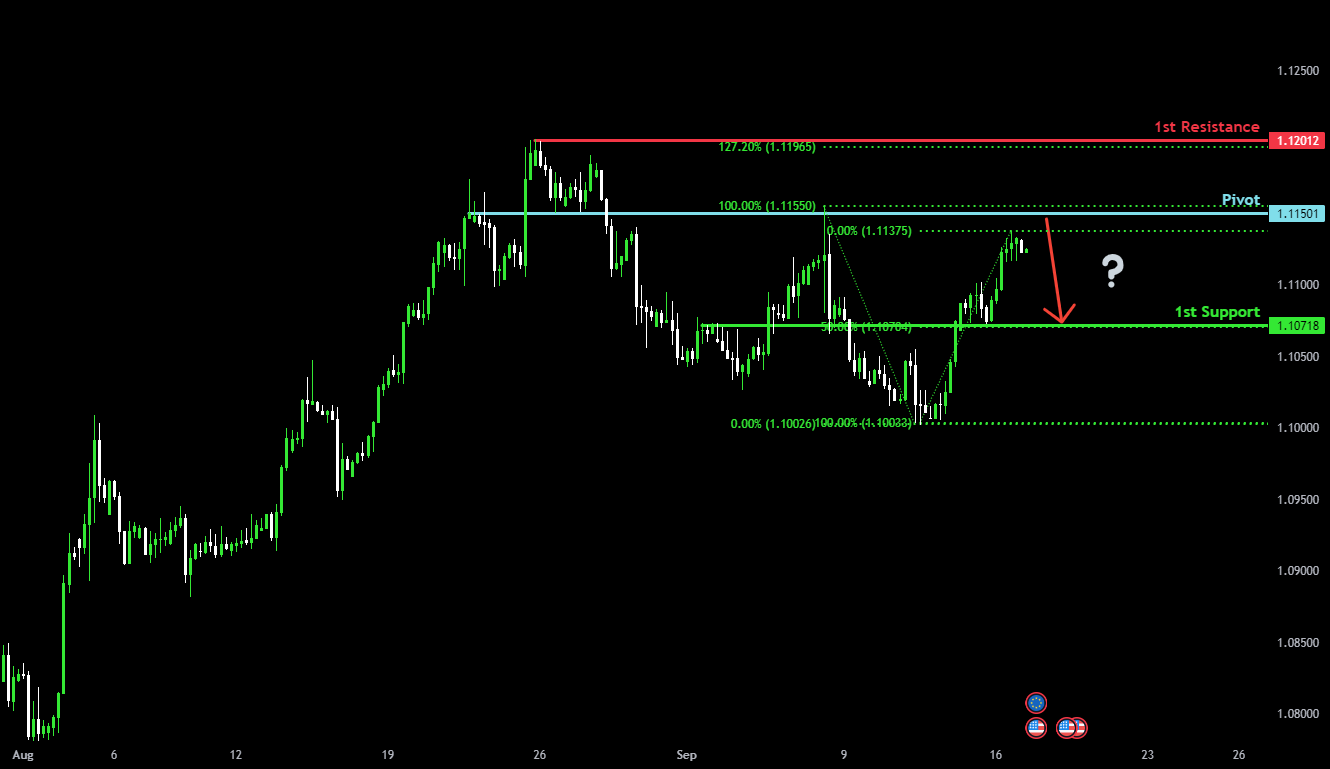
The Fiber (EUR/USD) is rising towards the pivot which acts as an overlap resistance and could reverse to the 1st support level which is also an overlap support.Pivot: 1.11501st Support:
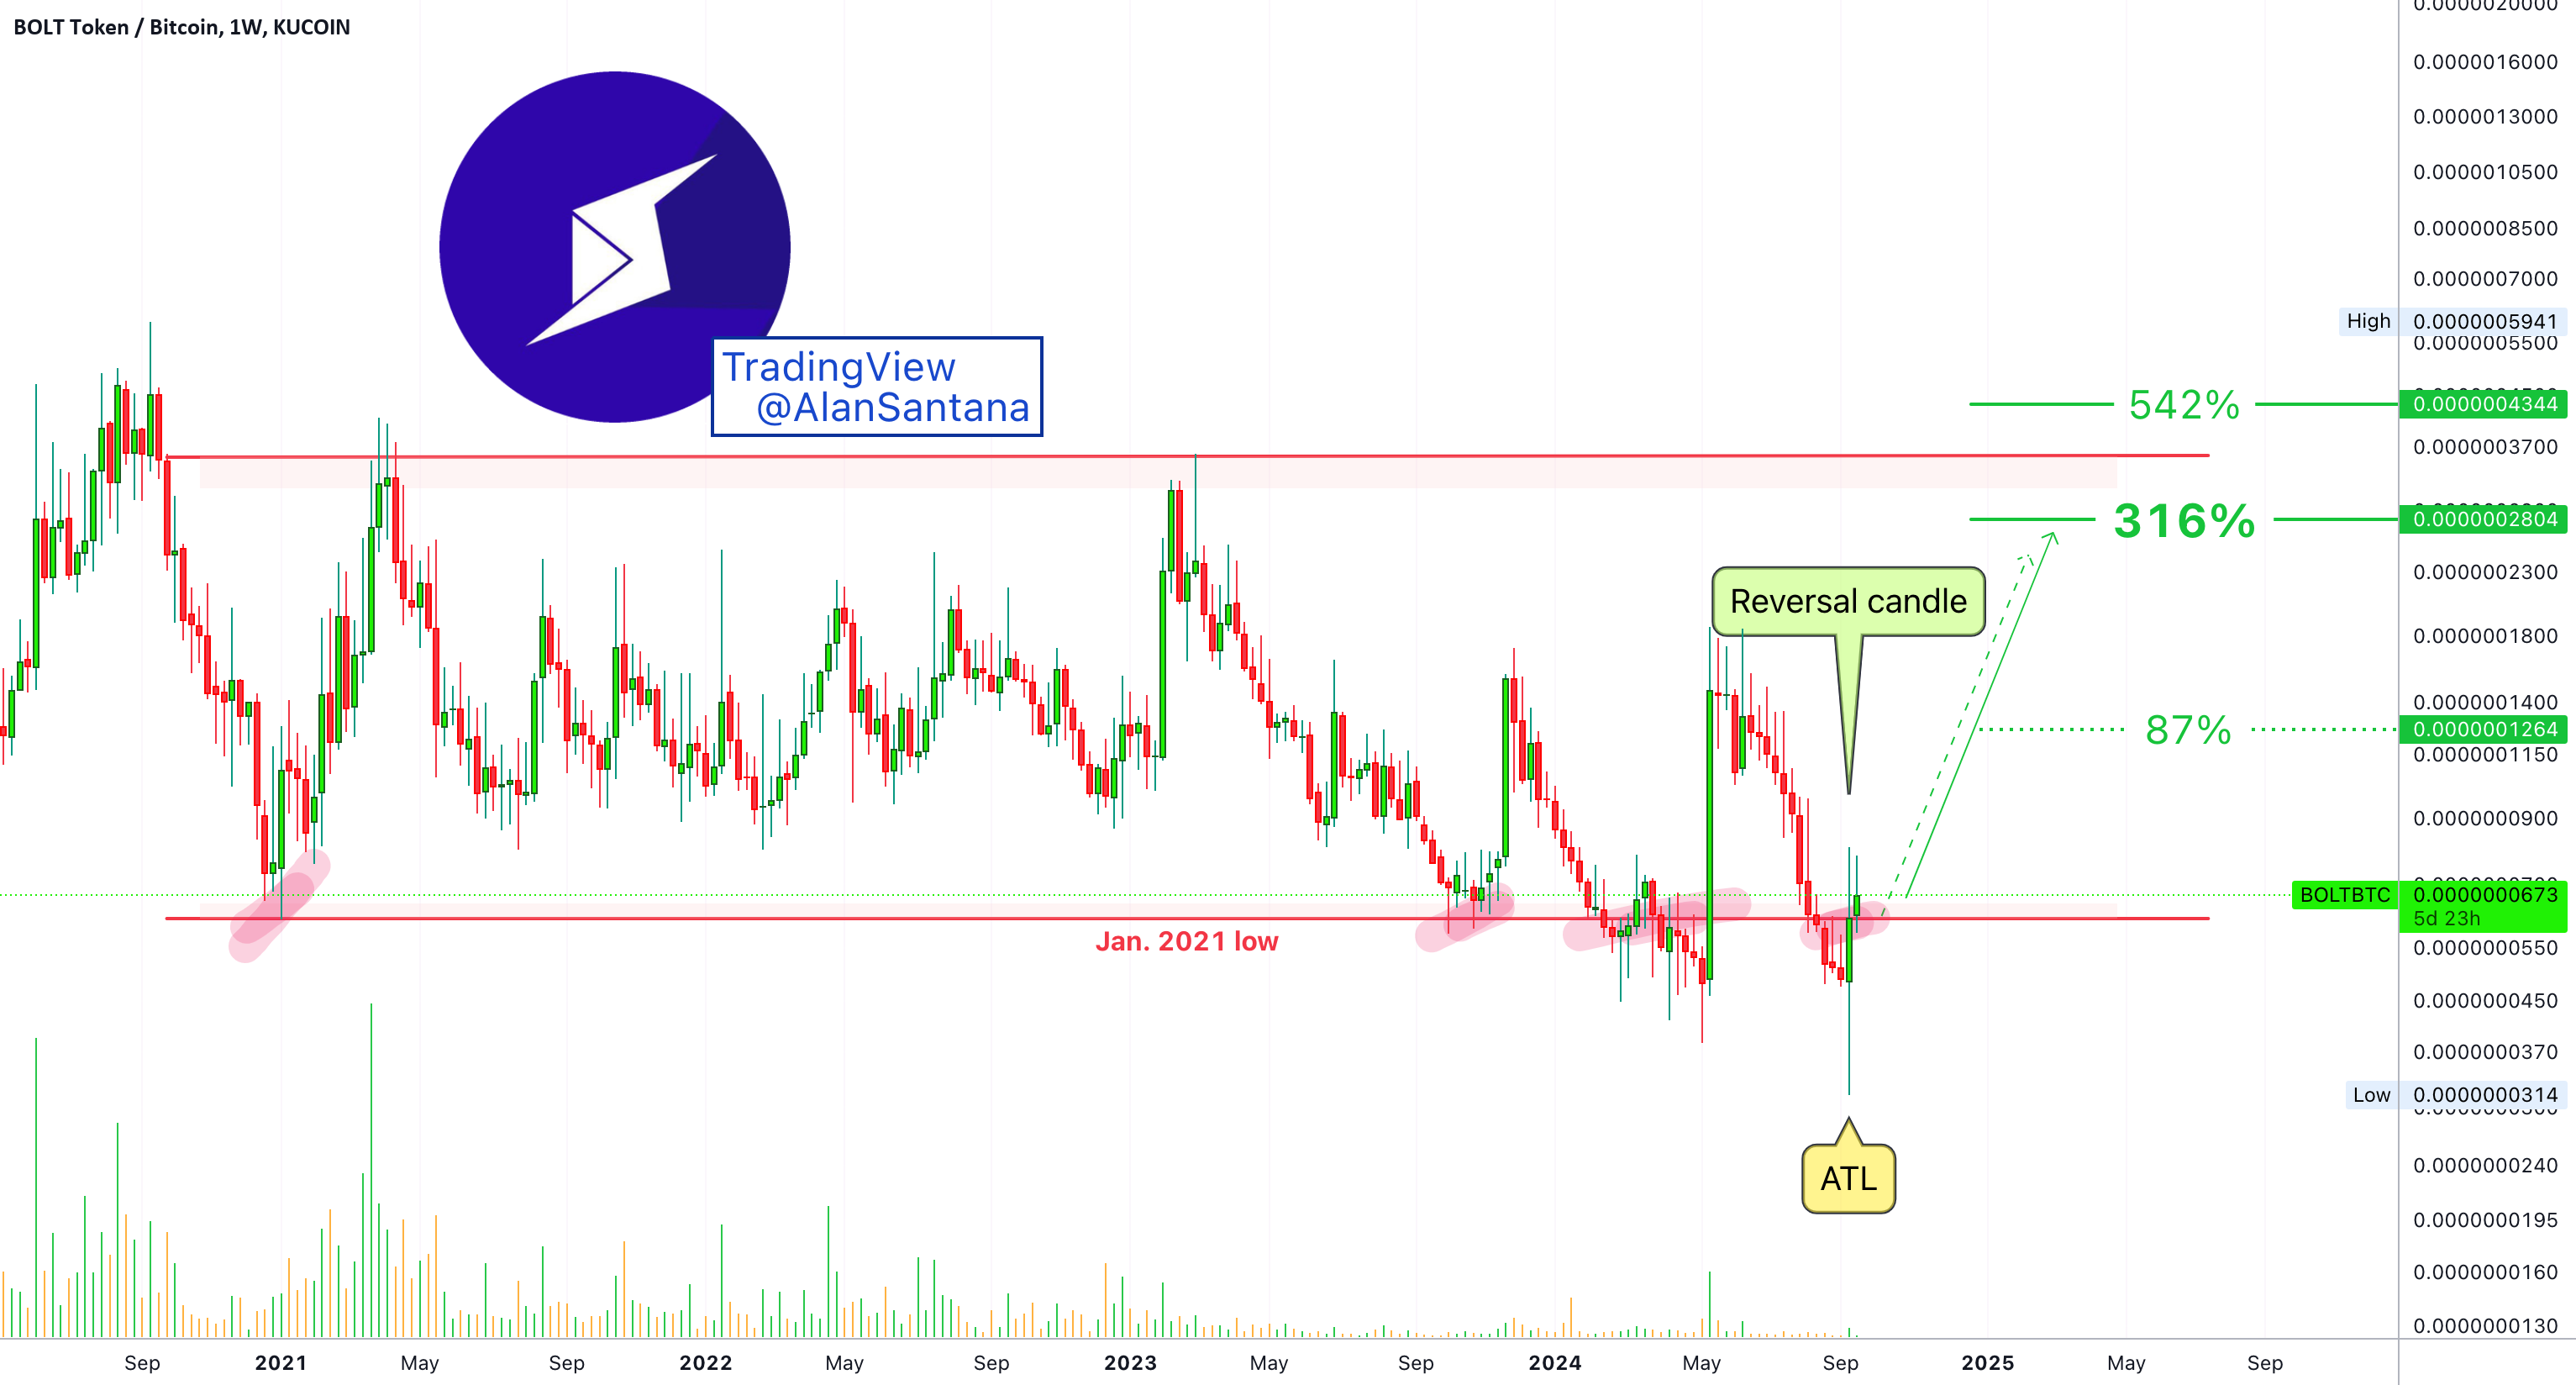
My dear reader, this is bullish confirmed!I can understand now why many people doubt what I am saying, because not "everything" will grow, but I never said everything will grow,
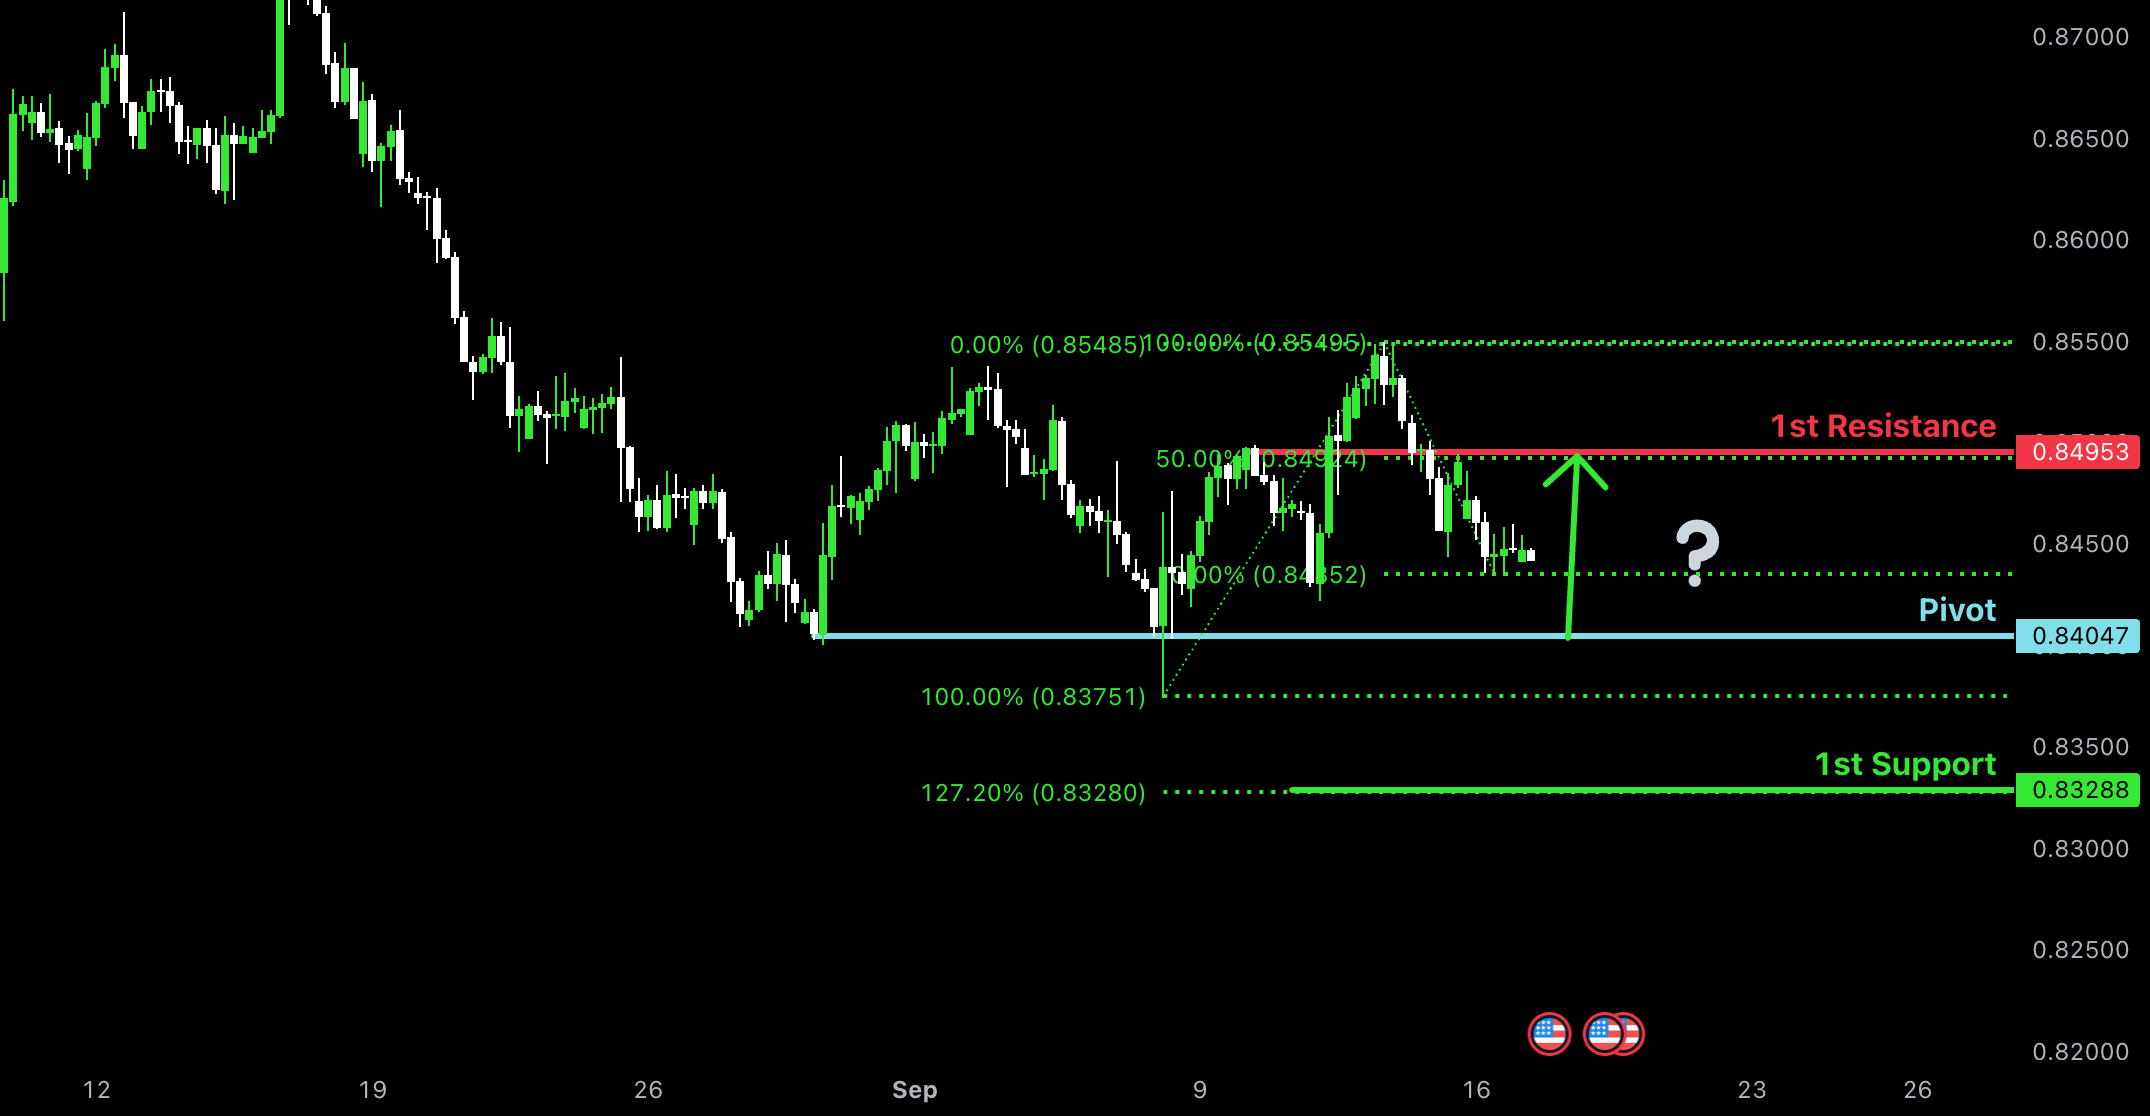
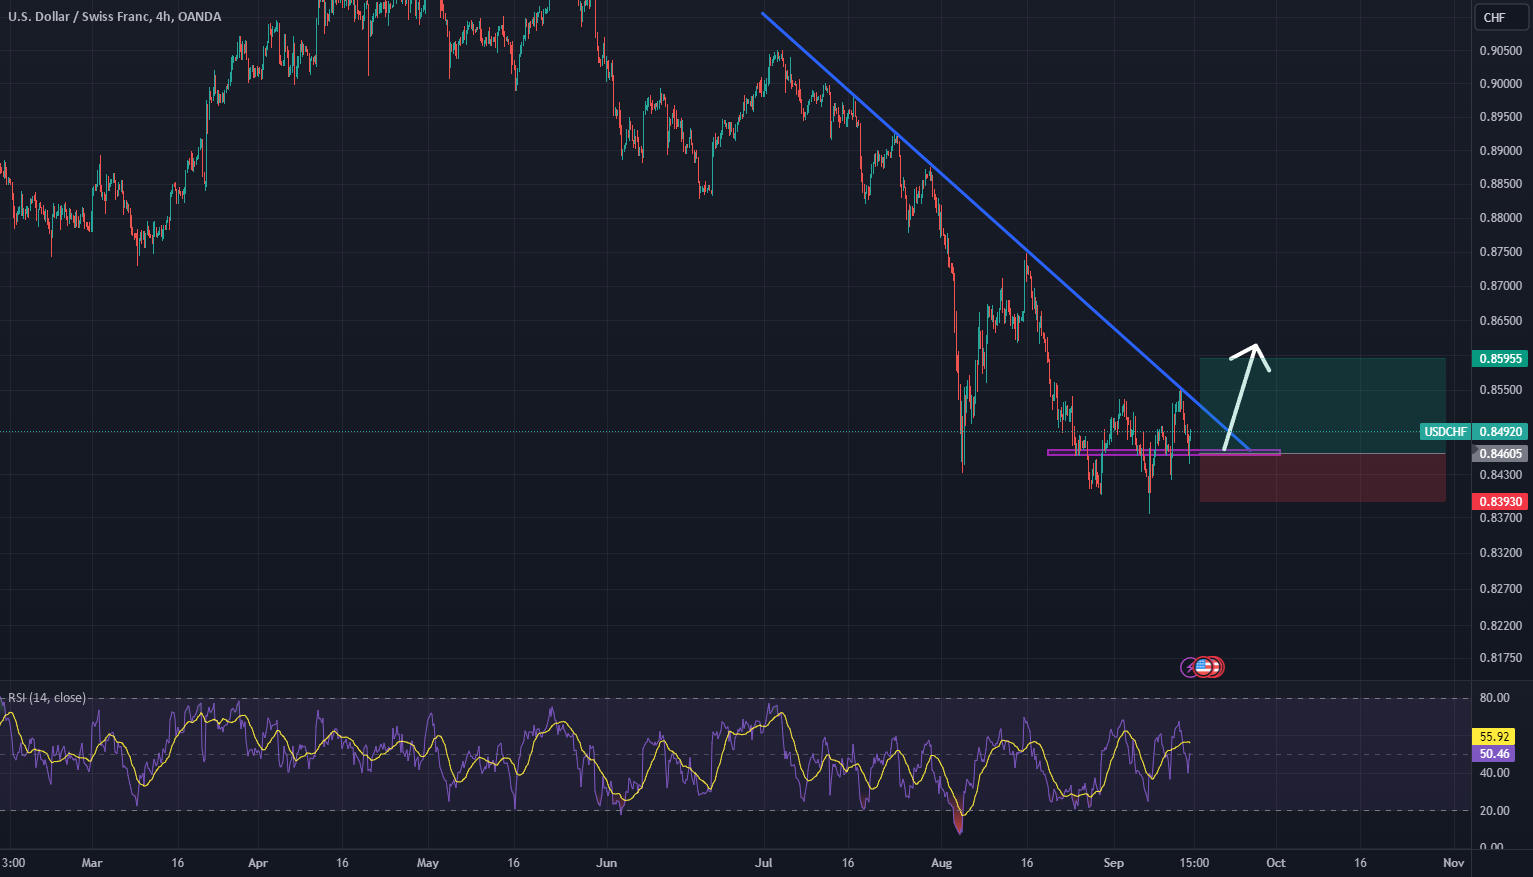
USD/CHF is falling towards the pivot and could bounce to the 1st resistance level that aligns with the 50% Fibonacci retracement.Pivot: 0.840471st Support: 0.83281st Resistance: 0.8495Risk Warning:Trading Forex and CFDs
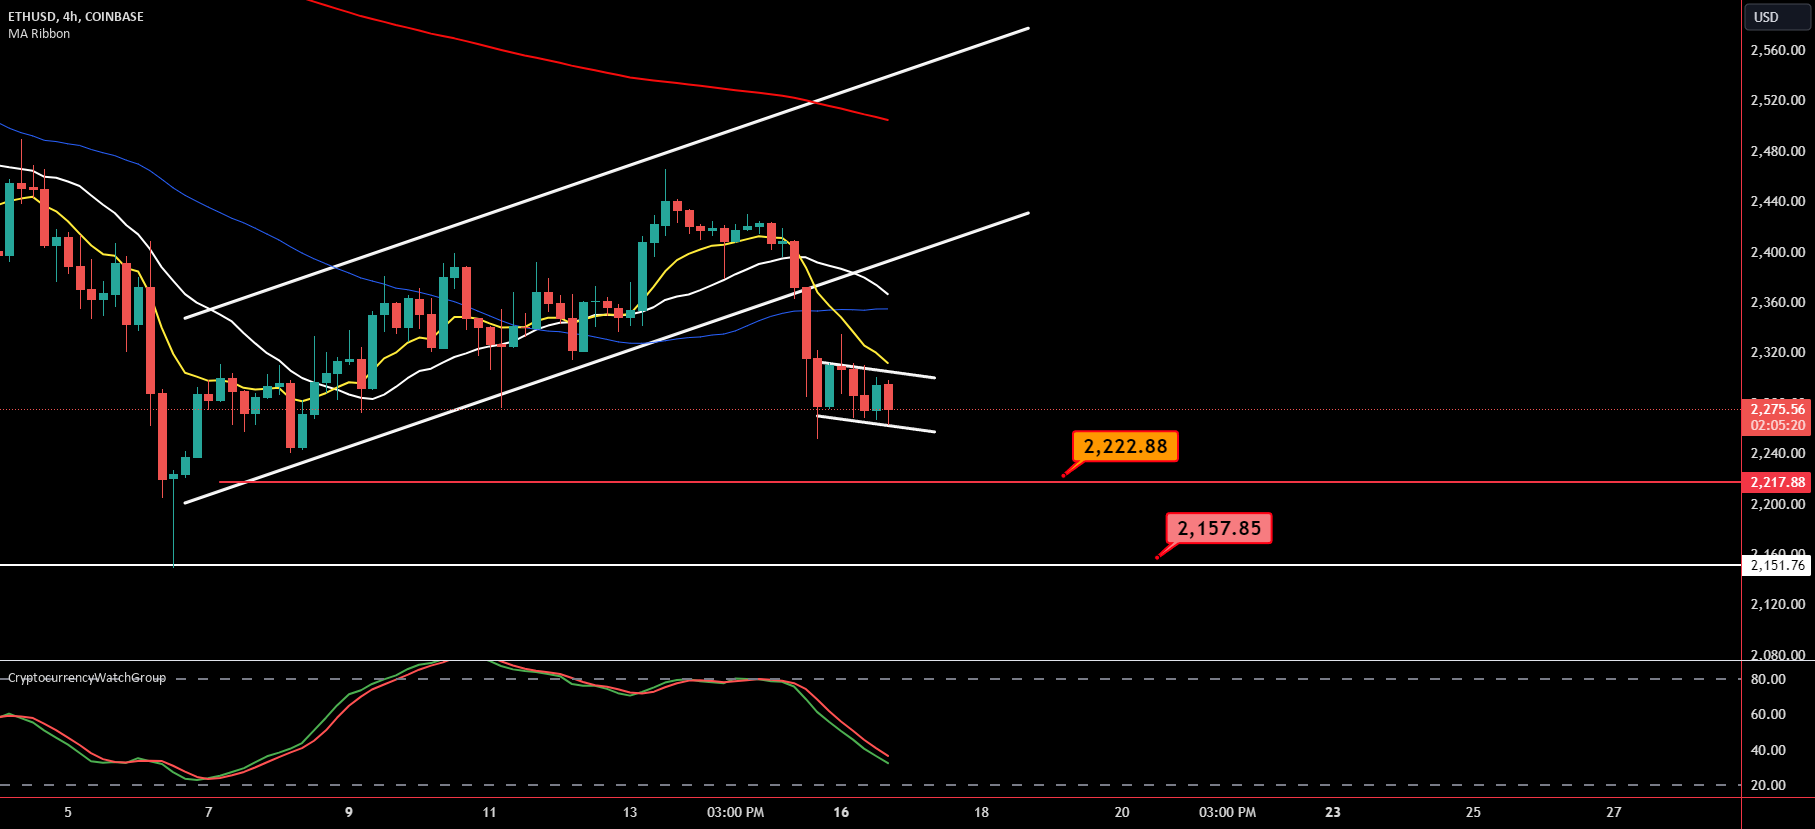
5 hours agoEthereum 4-hour chart on Coinbase looks extremely bearish, with ETH trapped in a descending channel. I'm quite disappointed in Ethereum's performance. Having been around for nearly 10 years,
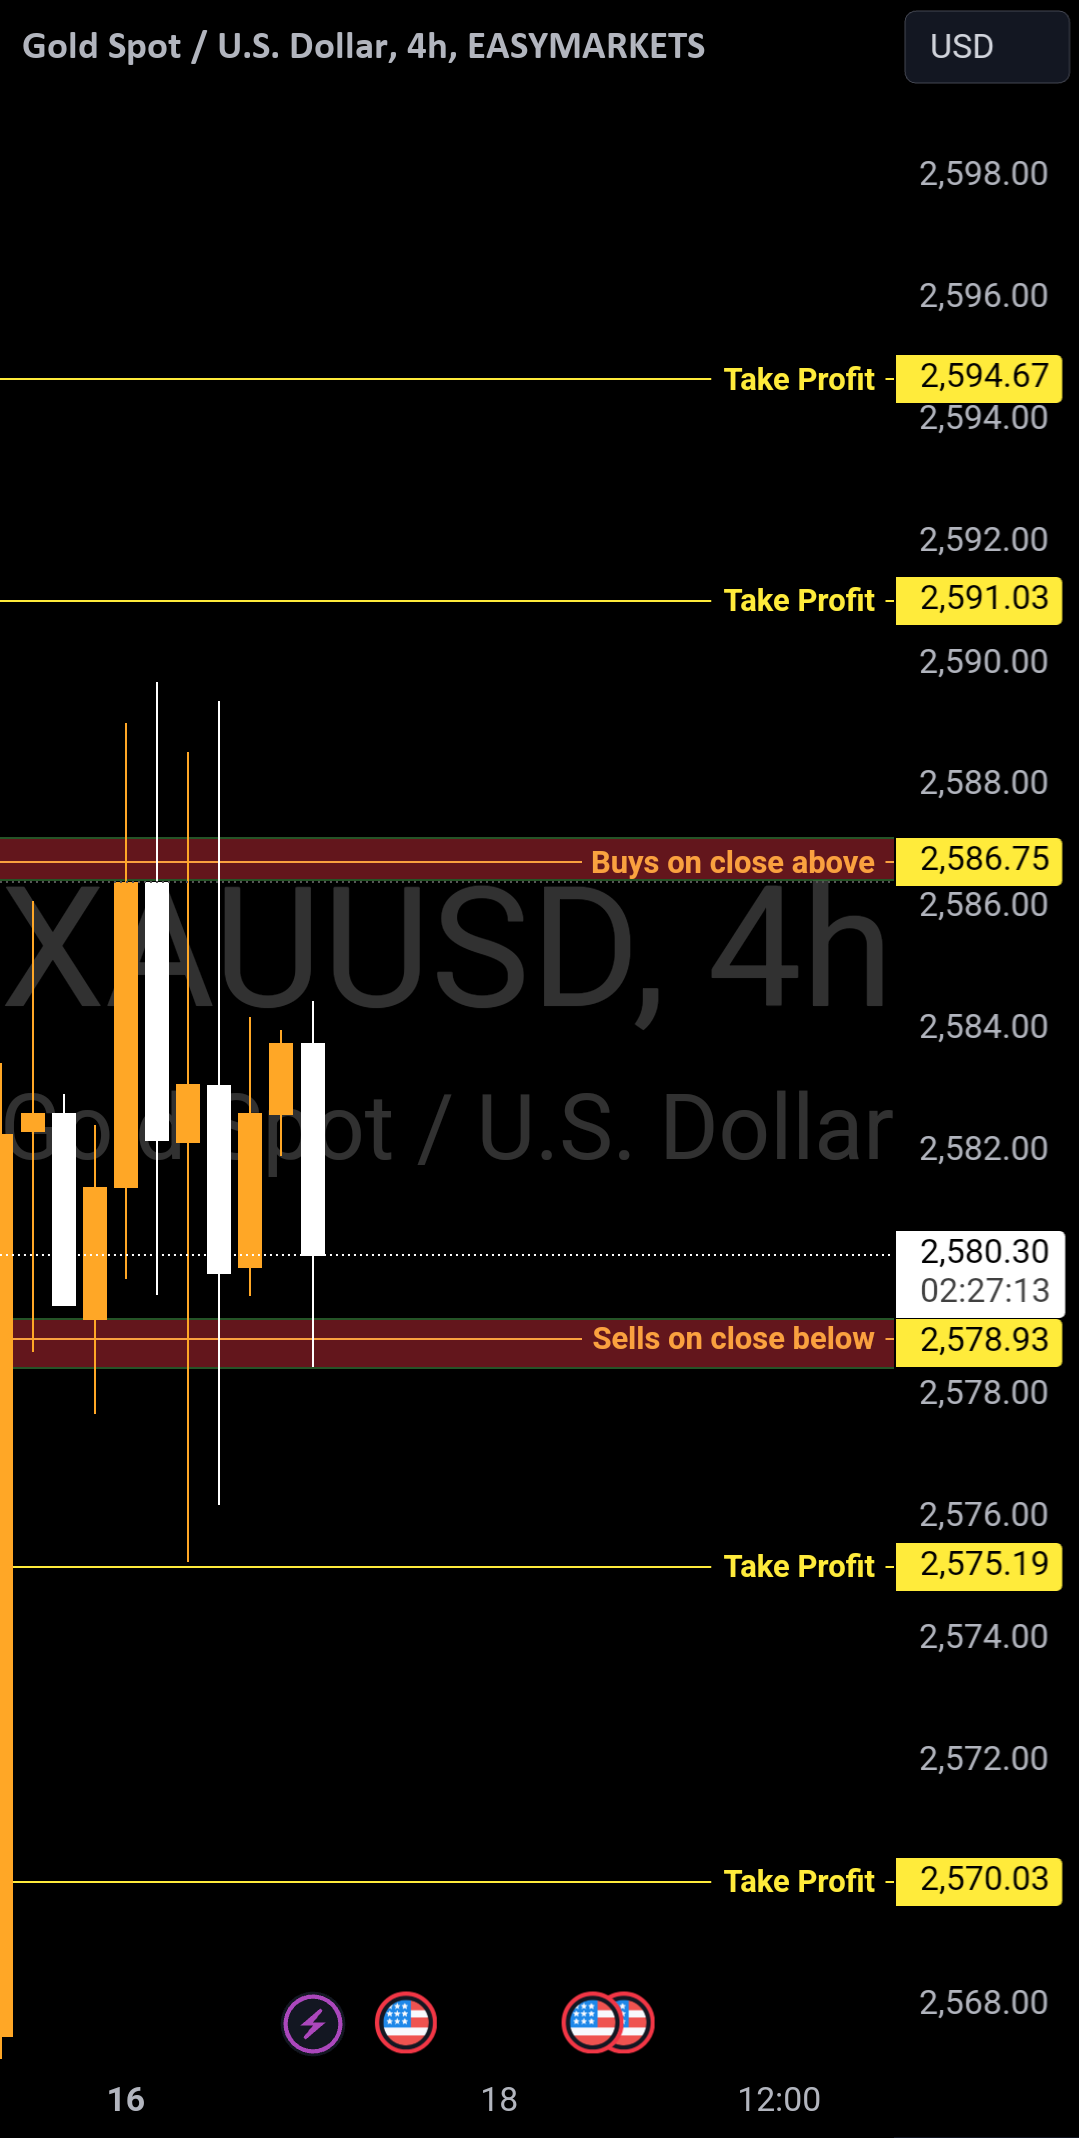
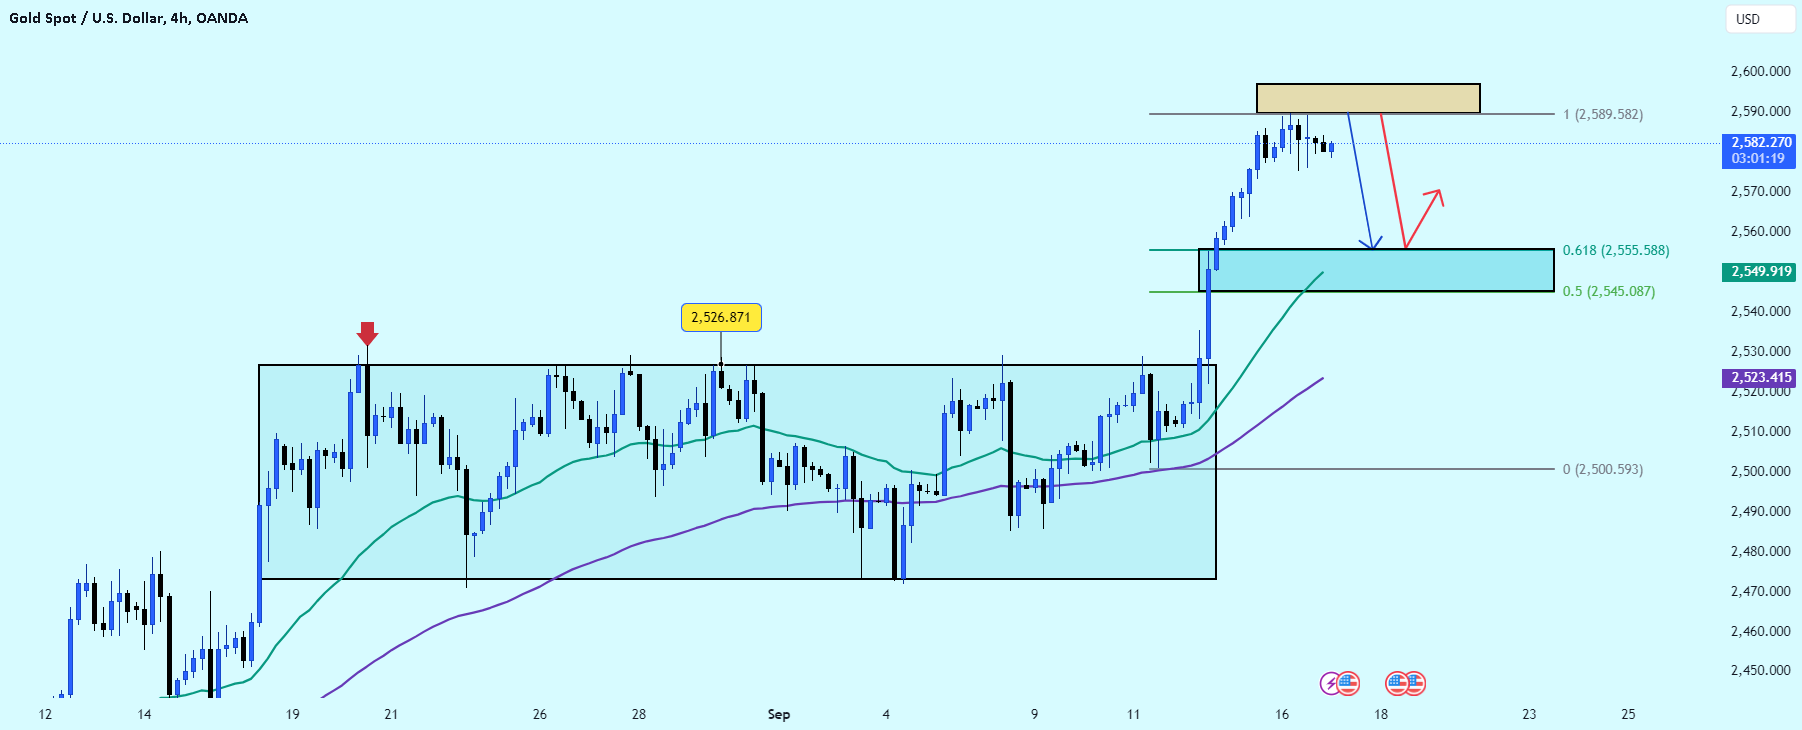
Hello dear friends, let’s dive into today’s gold price!As of Tuesday, gold continues to hold steady near the high levels, fluctuating around the $2580 mark, with little change from yesterday’s
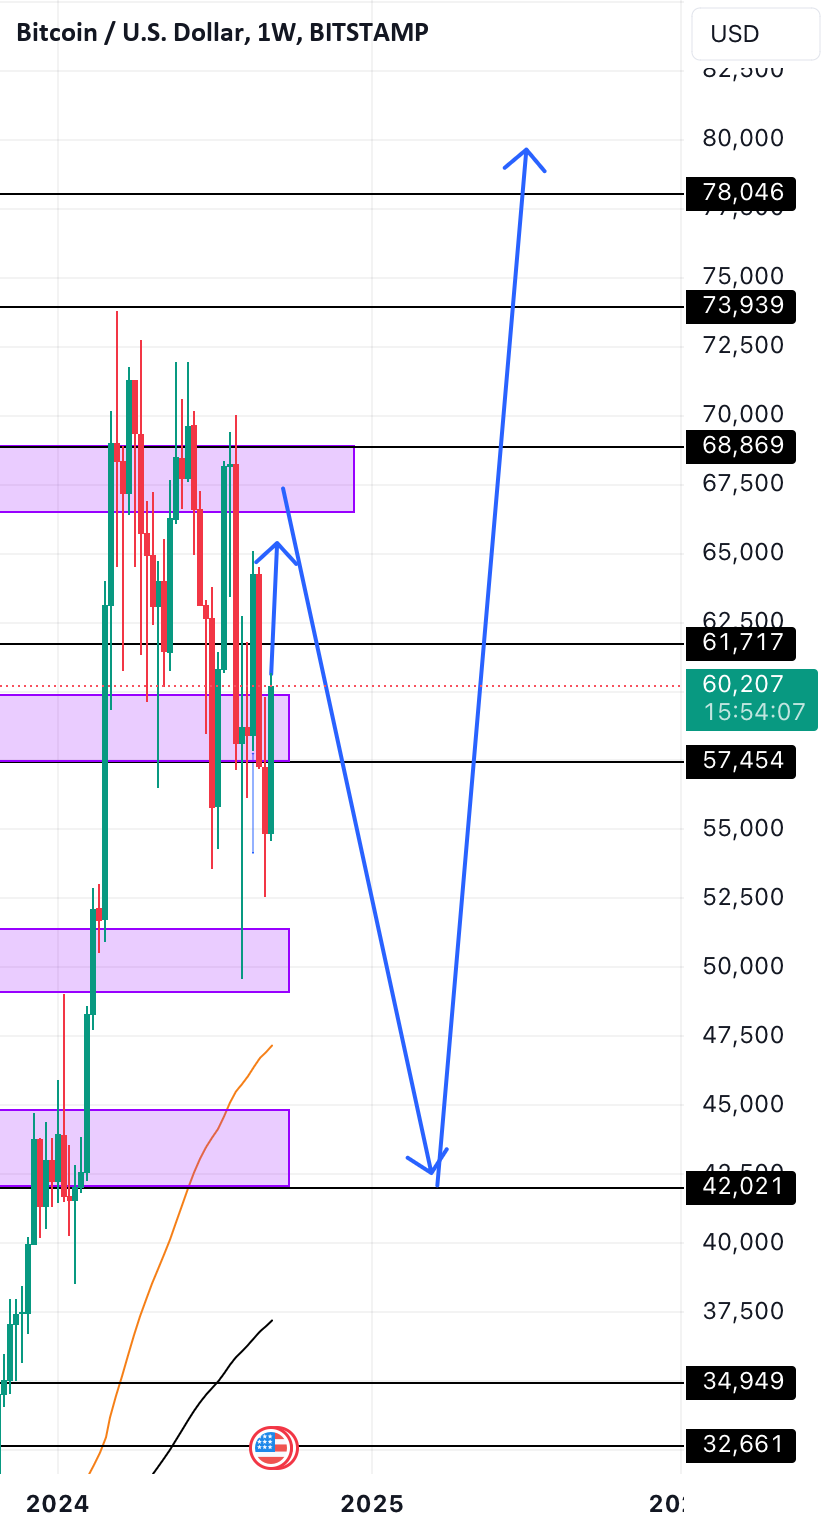
I’ve been tracking the course of bitcoin for the last 5 years. I think we are in for some major volatility soon!Scenario 1: The bitcoin price will rally as elections
1. Market Structure:The pair has been in a strong downtrend, as seen from the descending trendline marked in blue. However, the price is approaching a key support level (marked by
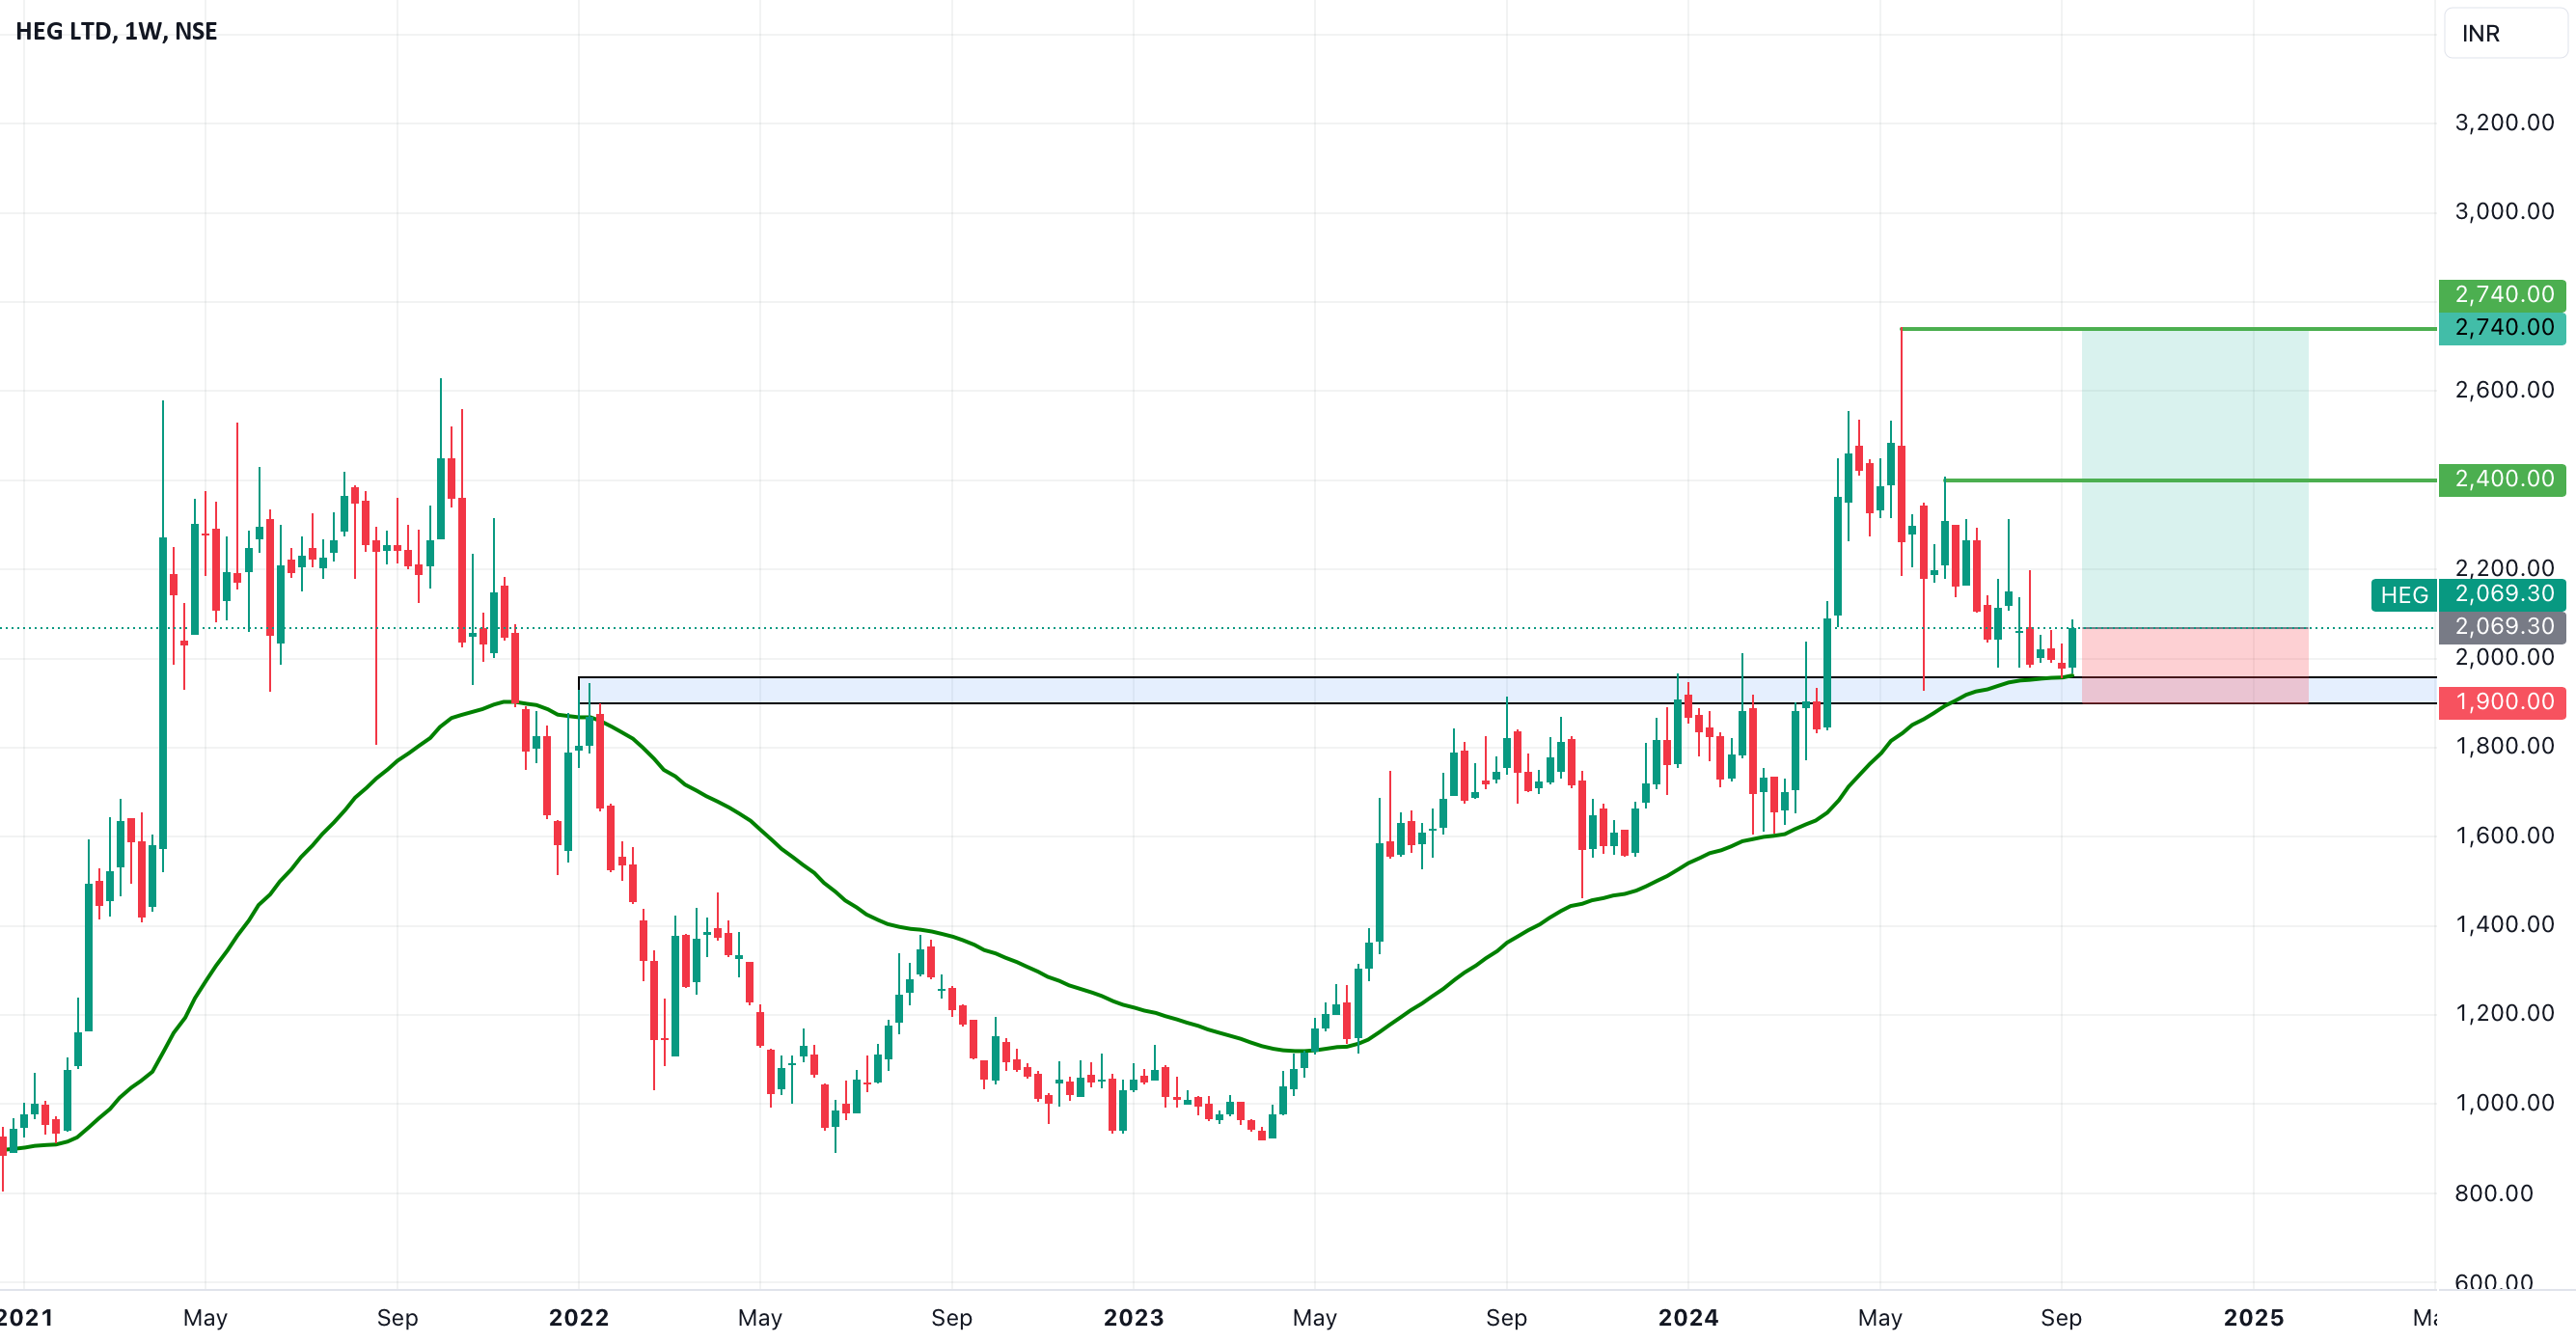
HEG, a key player in the graphite electrode industry, presents a strong swing trading opportunity Reasons are listed below :1950-2000 Strong Support Zone: This zone has proven to be a
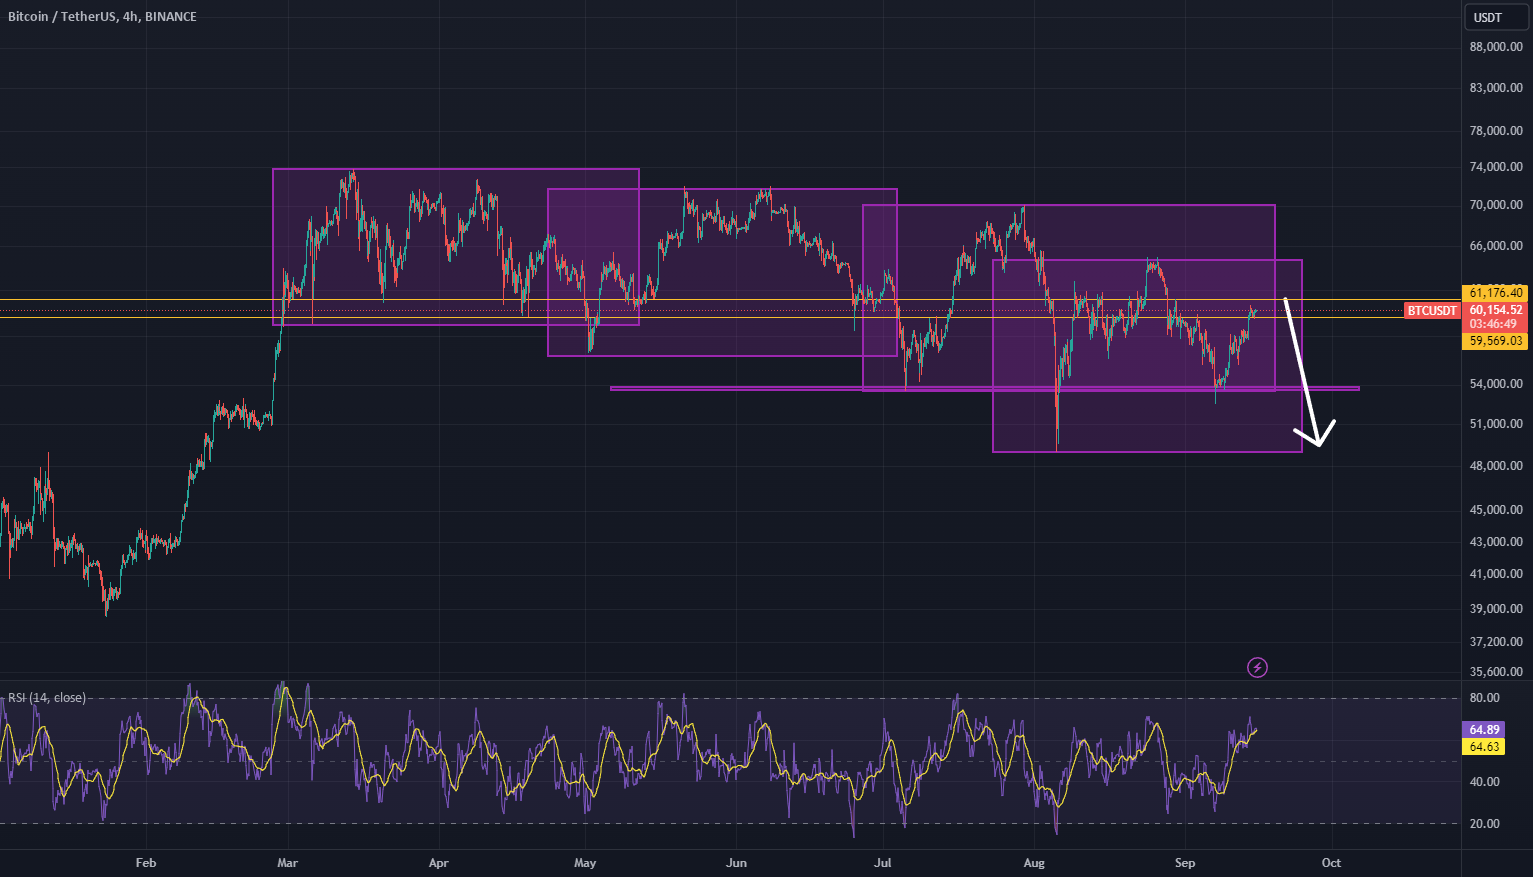
Looking at the chart for **Bitcoin (BTC/USDT)**, here’s a breakdown of the analysis:### 1. **Market Structure:**The chart shows a series of **consolidation ranges**, marked by the purple boxes, with the