
This article examines the USD/JPY’s technical outlook, analyzing key price levels that traders should watch over the coming trading sessions.

U.S. inflation rises 3.2% in February, faster than estimates
Looking for SPY continuation on 3-12-24 The chart shows a bounce on the 3 Day low yellow. Pink is 8 day low The blue line is the 5EMA on Day

Oil prices steady as Middle Eastern supply concerns ease
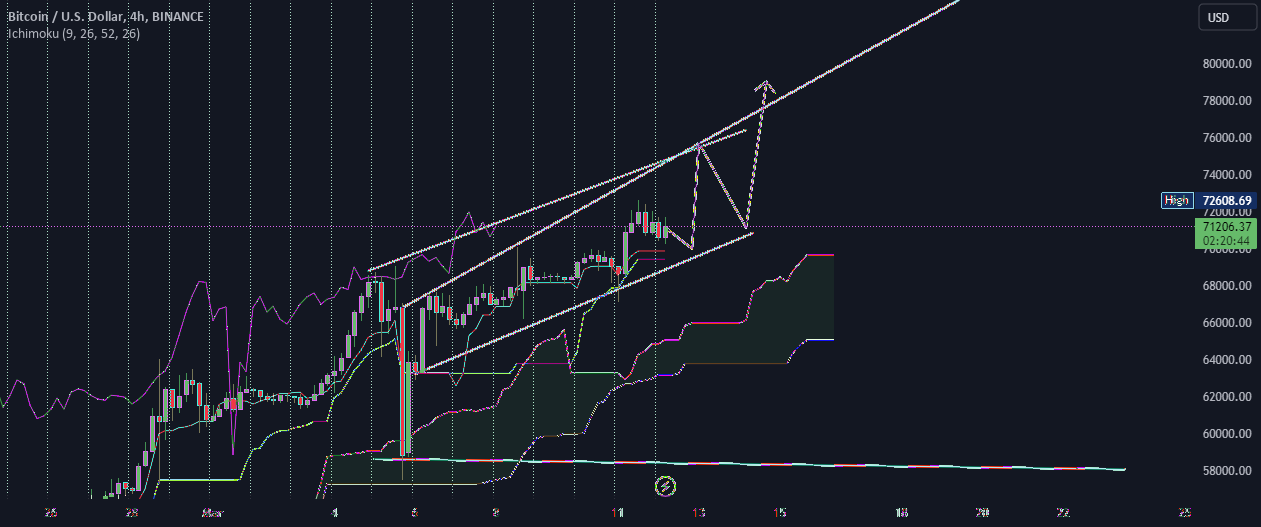
Bitcoin's price continues its upward trajectory, defying earlier predictions of a downturn. The cryptocurrency has witnessed a significant surge, propelled by increasing institutional adoption, favorable regulatory developments, and growing mainstream

India's January industrial output rises 3.8% y/y
Gold prices, the U.S. dollar, and stocks will be highly responsive to the February U.S. inflation report, as consumer price index data holds the potential to shape the Federal Reserve's

Sticky Feb US CPI inflation raises questions about June Fed cut

Tyson Foods to close Iowa pork plant with 1,200 workers
The chart shows price at 3 Day low yellow. Pink is 8 day low The blue line is the 5 EMA on Day timeframe with 1.5 deviation bands. A stock