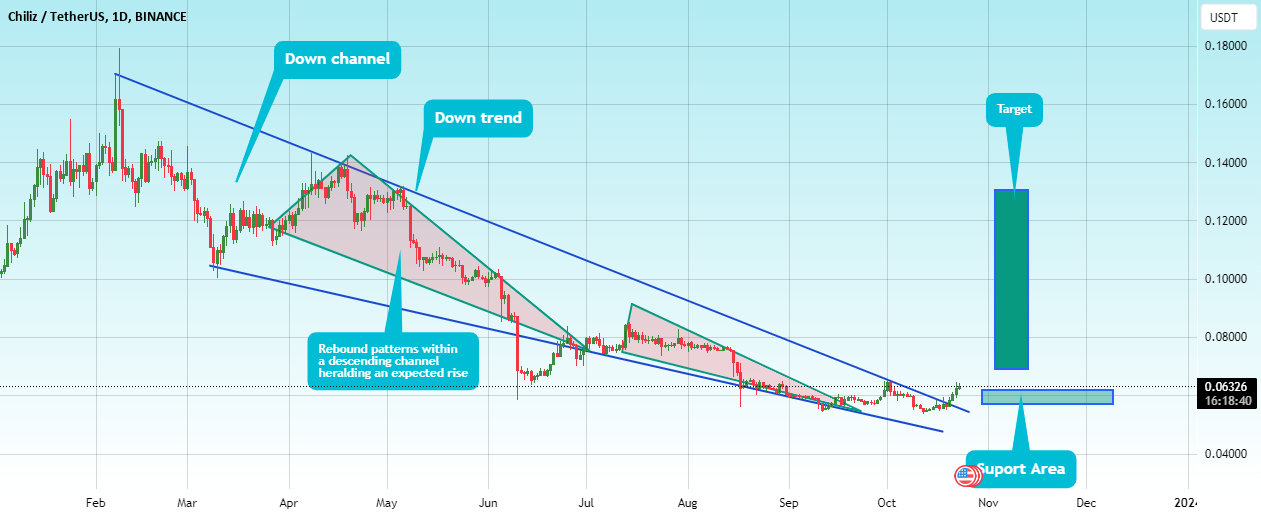
#CHZ We have been trading within a descending triangle pattern since last February Over the months, the price respected the downward trend and gained momentum With the presence of regression
️Name : EUR/AUD Time Frame : 4hrs Chart (️Short Order ) ------ 🧾 : WHY IS EURAUD GOING DOWN? Changes in interest rates from the respective central banks, such as
The gold price pulled back to start the week after notching a five-week peak last Friday. Higher Treasury yields and US Dollar look to have been overrun by swirling risks
Crude oil’s downward correction that started a few weeks ago may not be over just yet. Natural gas has retreated following the bullish break earlier this month. How much more
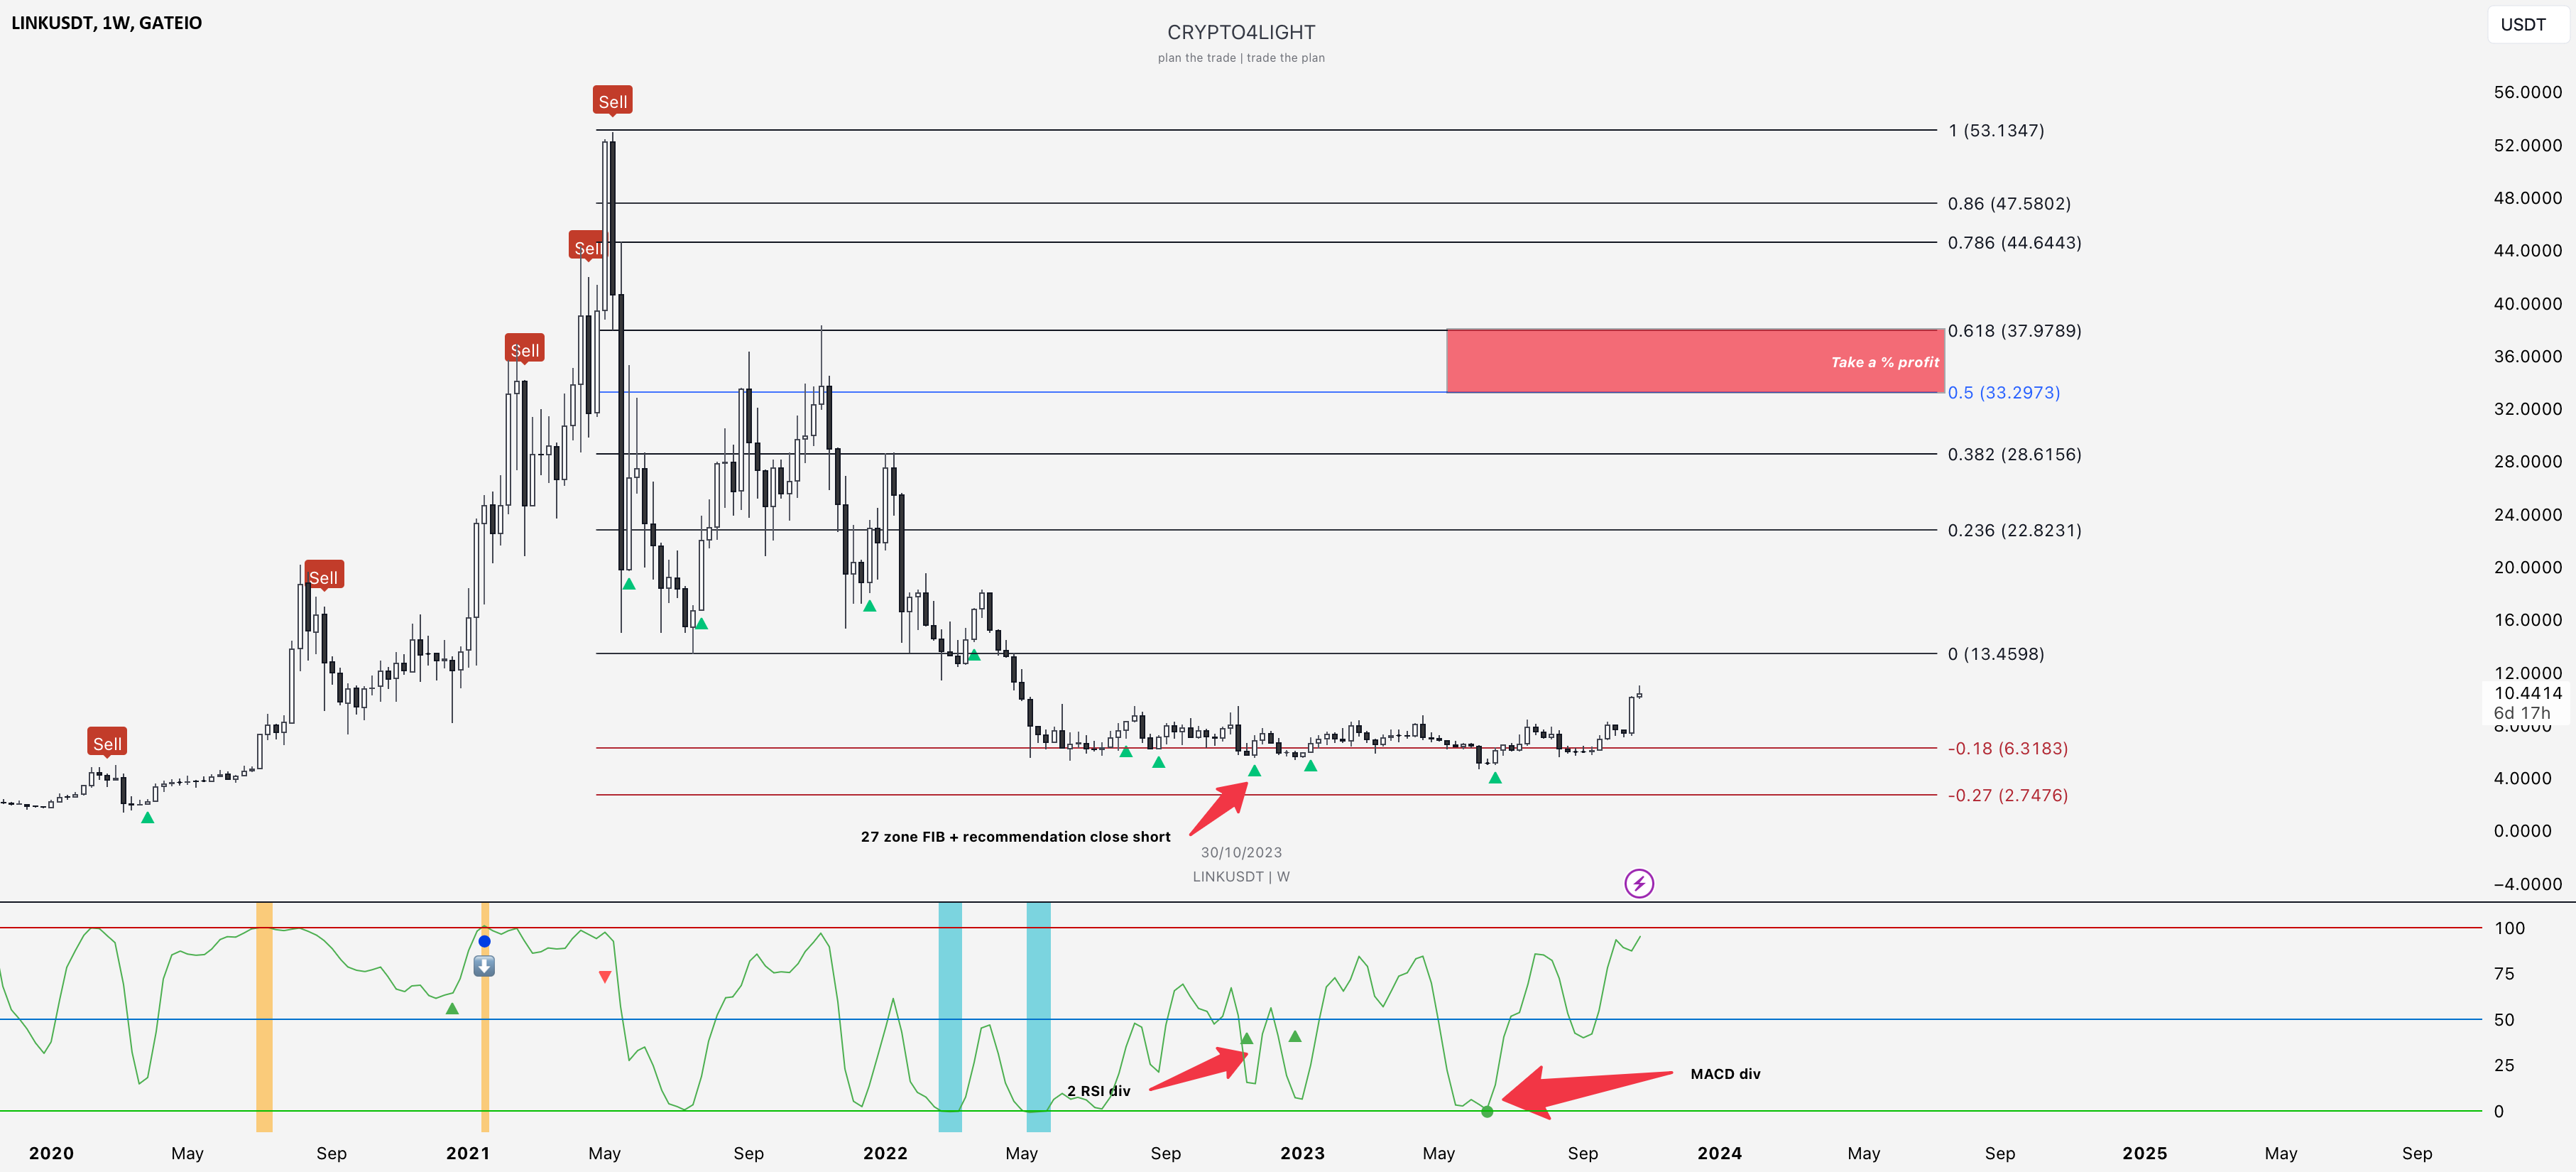
Chainlink take profit targets Possible Targets and explanation idea ️Over 530 days in a range around 27 fib zone ️A lot of recommendation close short position signals by Trade ON