Hello?
Hello traders!
If you “Follow” us, you can always get new information quickly.
Please also click “Boost”.
Have a good day.
————————————-
(XMRUSDT chart)

(1D chart)


If not, it is expected to rise above 145.55-146.69.
However, since a trend is expected to be formed only when it breaks out of the 140.50-148.12 box range, I think it is better to respond briefly when trading within the box range.
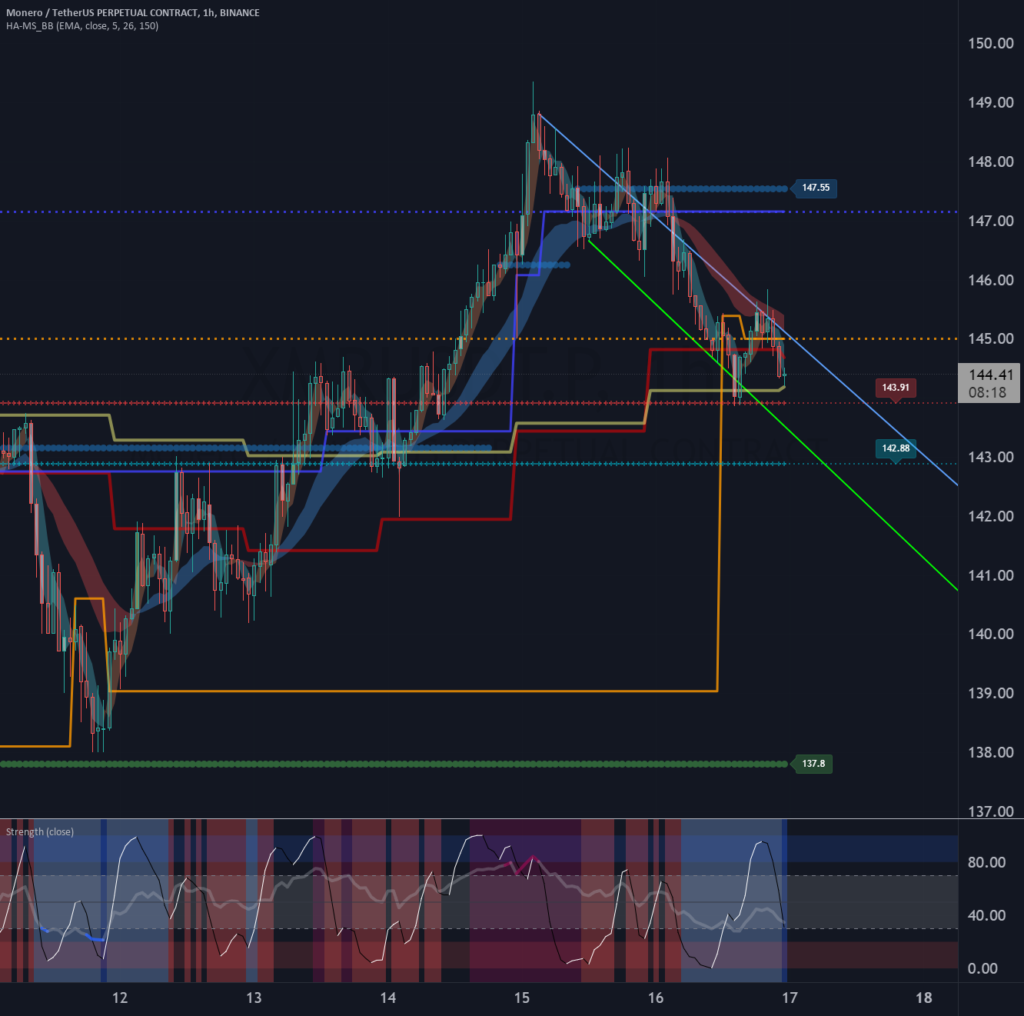
(1h chart)

Therefore, in order to maintain SHORT, it must fall below the 142.88-143.91 range.
Therefore, it is recommended to respond briefly in the 142.88-145.0 range.
If it falls below 142.88, it is expected to fall to around 137.8-139.03.
If it rises above 145.0, it is expected to rise to around 147.15-147.55.
————————————————–
To sum up, since it is within the box section, short section trading using the top and bottom of the box section is in progress.
If you do not want to trade in a short corresponding zone, it is better to wait for a break out of the box zone on the 1D chart.
————————————————– ——————————————-
** All explanations are for reference only and do not guarantee profit or loss in investment.
** Trading volume is displayed as a candle body based on 10EMA.
How to display (in order from darkest to darkest)
More than 3 times the trading volume of 10EMA > 2.5 times > 2.0 times > 1.25 times > Trading volume below 10EMA
** Even if you know other people’s know-how, it takes a considerable amount of time to make it your own.
** This chart was created using my know-how.
———————————


