

Plans from the 20th worked out really well.
We had our sweep to the downside hitting tp1, but then reversed and followed the bullish path.
Good opportunity to look have a fresh look at the charts.
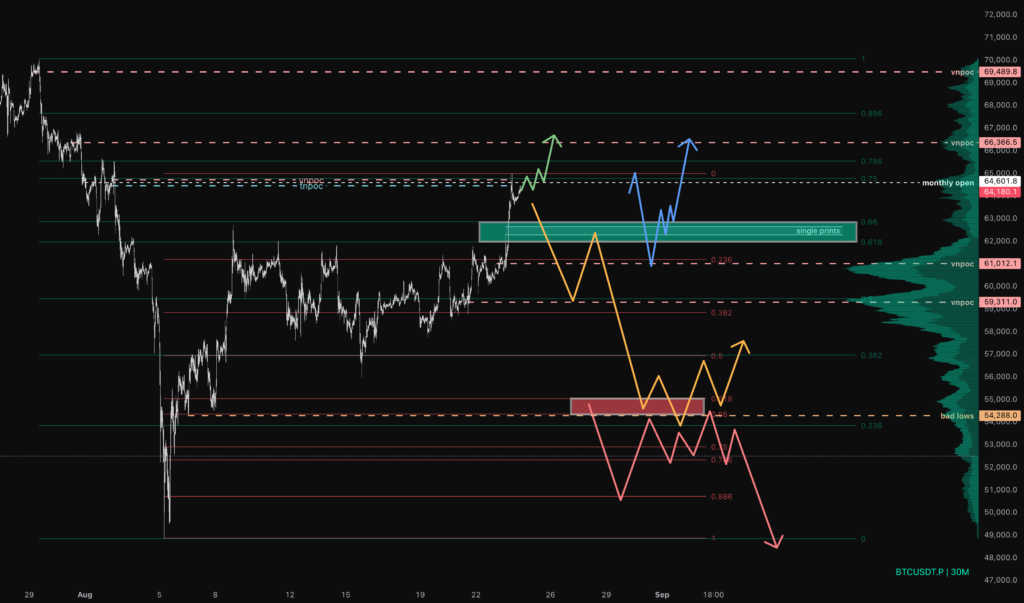
We had our initial htf move down, which I fibbed in green.
Now we had a decent bounce that broke through the green golden-pocket, fibbed in red.
(if we keep squeezing higher, we have to keep adjusting this fib of course)
Why are these fibs important? Let’s look at some scenarios
Green: We keep going higher first. Not much to say about that, except re-evaluate when we’re higher.
Blue: We broke through the golden pocket (gp), which means that if bulls can turn it into support, they have a good chance of breaking the fib high. There is a single print in this gp as well, giving a good opportunity for price to go back down there. Bulls want to see gp hold on a candle closing basis (this is of course subject to timeframe, so not really hard science)
Yellow: We lose gp and take some lower levels. Now bulls want to reclaim gp as soon as possible, bears want to see it hold as resistance.
On the green fib, this lines up with a common 0.75 – 0.5 – 0.618 rotation. Losing 0.5 would not be a good look short term, which is when we start looking at the red gp for support.
Red: lose the red gp, then we are at the reverse of the blue scenario: bears now have good odds of breaking the fib low, after turning the red gp into resistance.
Hope that’s not too confusing, and really sorry for those of you who are colorblind. Squiggles on the chart should help a lot though.