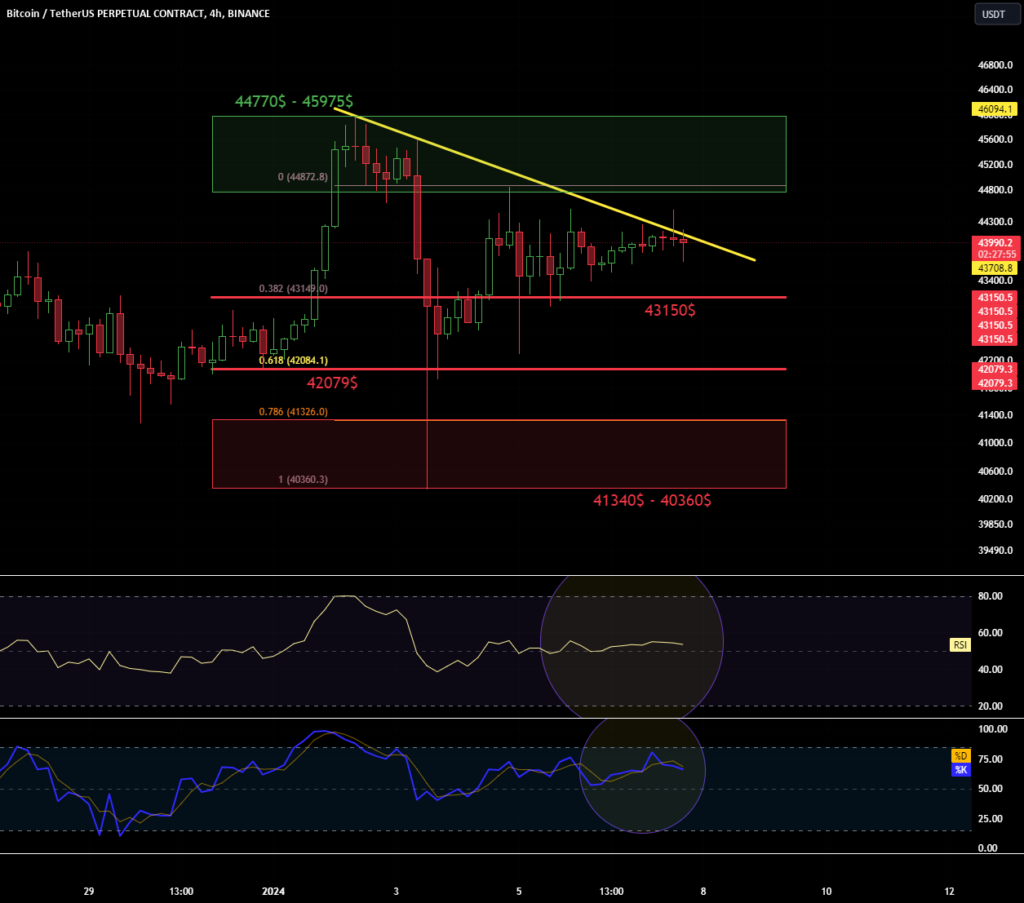
Hello everyone, let's take a look at the BTC to USDT chart on a 4-hour time frame. As you can see, the price is fighting against the local downtrend line. However, when we unfold the fib retracement grid, we can see that the price is being rejected by a strong resistance zone from $44,770 to $45,957, which is keeping the price from moving towards $48,000. Looking the other way, there is support at $43,150, second at $42,079, and then a strong support zone from $41,340 to $40,360. On the RSI …

BTC/USDT 4HInterval Chart for BINANCE:BTCUSDT
Hello everyone, let's take a look at the BTC to USDT chart on a 4-hour time frame. As you can see, the price is fighting against the local downtrend line. However, when we unfold the fib retracement grid, we can see that the price is being rejected by a strong resistance zone from $44,770 to…
Shares:

