ETHUSD
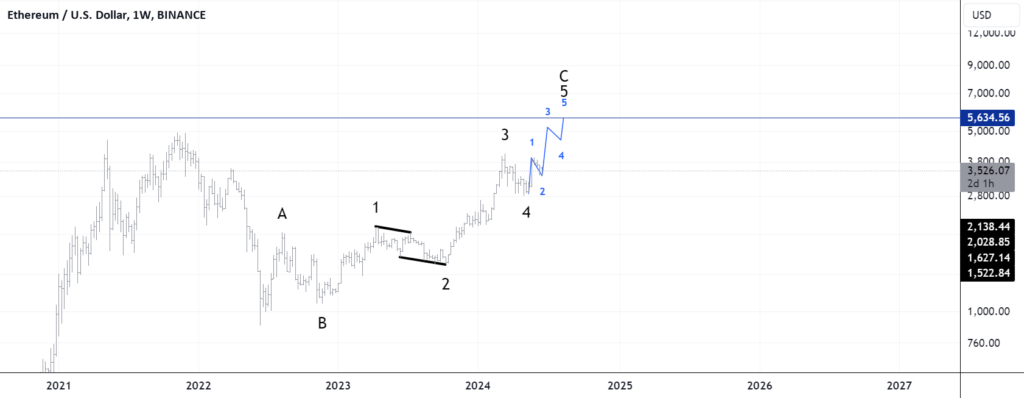
In this chart, we analyze the weekly price action of Ethereum (ETH/USD) using Elliott Wave Theory. The chart shows a clear wave structure, indicating potential future price movements.
Wave A (2022 Downtrend):
Ethereum experienced a significant decline, marking the completion of Wave A.
This wave is characterized by a sharp drop in prices, indicating strong bearish sentiment.
Wave B (2022-2023 Correction):
Following the decline, Ethereum entered a corrective phase, forming Wave B.
This phase shows a temporary recovery but doesn’t surpass the previous high.
Wave 1 of C (Early 2023 Rally):
Wave 1 initiates the start of a new bullish cycle.
Ethereum begins to recover, showing a strong uptrend with increasing investor confidence.
Wave 2 (Mid-2023 Pullback):
Wave 2 is a corrective wave, characterized by a pullback in prices.
This wave often retraces a portion of Wave 1, offering a buying opportunity.
Wave 3 (Late 2023 Surge):
Wave 3 is typically the most powerful wave in the Elliott Wave structure.
Ethereum experiences a robust rally, surpassing previous highs and indicating strong bullish momentum.
Wave 4 (Early 2024 Consolidation):
Wave 4 is a consolidation phase, where prices stabilize and form a base.
This wave often exhibits sideways movement, preparing for the next upward thrust.
Wave 5 of C (2024 Bullish Continuation):
Wave 5 marks the final leg of the bullish cycle, leading to new highs.
Ethereum is expected to reach its all-time high (ATH) during this wave, driven by strong market sentiment and fundamental factors.
Subwaves within Wave 5:
Detailed subwaves within Wave 5 show the intricate price movements and corrections.
These subwaves help in identifying potential entry and exit points for traders.
️ This analysis is not financial advice and is intended for educational purposes only. Traders should do their own research and consider their risk tolerance before making any trading decisions.


