
Market Overview KAIAUSDT has shown a strong bounce from the lower boundary of the descending channel, with signs of a potential trend reversal. The price is attempting to break the
// @ Julien_Eche//version=5indicator('Machine Learning Signal Filter', '', true)//**** Display Options ****displayMetrics = input(true, 'Display Neural Metrics?')dataCurves = input(false, 'Display Signal Curves?')//**** Signal Calculations ****signalEaster = input(true, 'Activate Signal Calculations?')useDataForSignal =
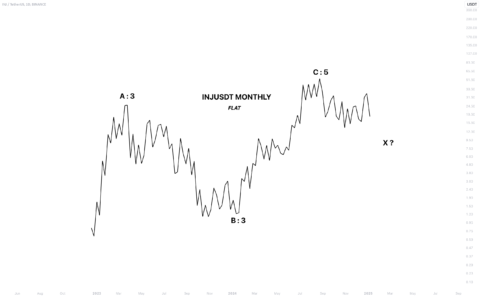
Wave A is the fastest and strongest wave on the chart, indicating that the long-term trend is up, and any downward wave is counter-trend.The pattern is a flat correction, confirmed
XRP in Perspective: How Will the SEC Lawsuit Impact Price? The ongoing legal battle between Ripple (XRP) and the U.S. Securities and Exchange Commission (SEC) has become a defining moment
2 hours agoSupport and Resistance Levels:Support Levels: These are price points (green line/shade) where a downward trend may be halted due to a concentration of buying interest. Imagine them as
#Bitcoin (BTC) Analysis and StrategyThe current market resembles the 2021 bull run, with a consolidation Phase around 98,000 - 100,000 USDT, signaling a potential breakout.Support: 94,000 USDT, 90,000 USDT.Resistance: 100,000
1 minute agoSupport and Resistance Levels:Support Levels: These are price points (green line/shade) where a downward trend may be halted due to a concentration of buying interest. Imagine them as
GOLD is trading around 2,602. bouncing off the low of 2,582. Now the price is above 2,600 which means it could continue its rise in the next few hours and
As you can see in the orange line, there is a nice buy in this session. I expect this buy to carry the price above the blue line, which is
Dear friends, hello to everyone.I previously mentioned the inverse cup-and-handle pattern on the LTCUSDT pair, with the final target being $53. Currently, after reaching the 1.618 Fibonacci level, there is