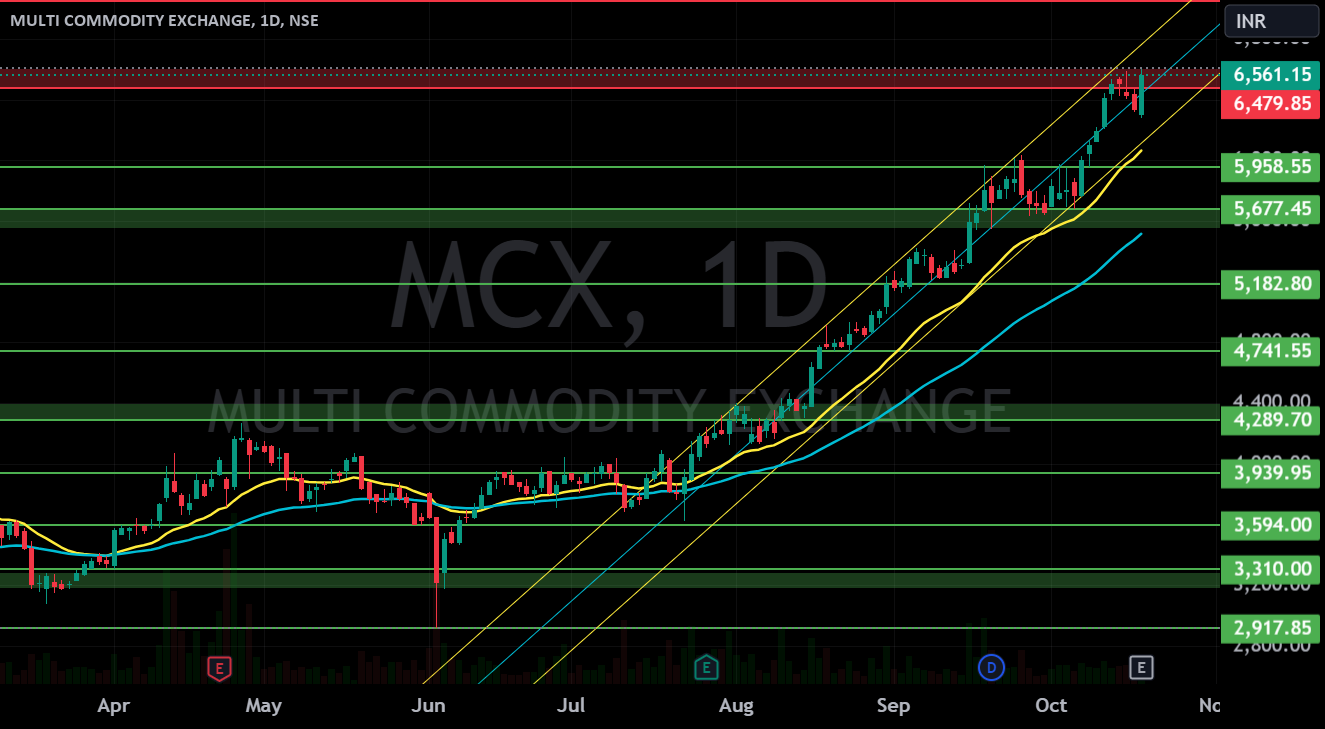
Support and Resistance Levels:Support Levels: These are price points (green line/shade) where a downward trend may be halted due to a concentration of buying interest. Imagine them as a safety
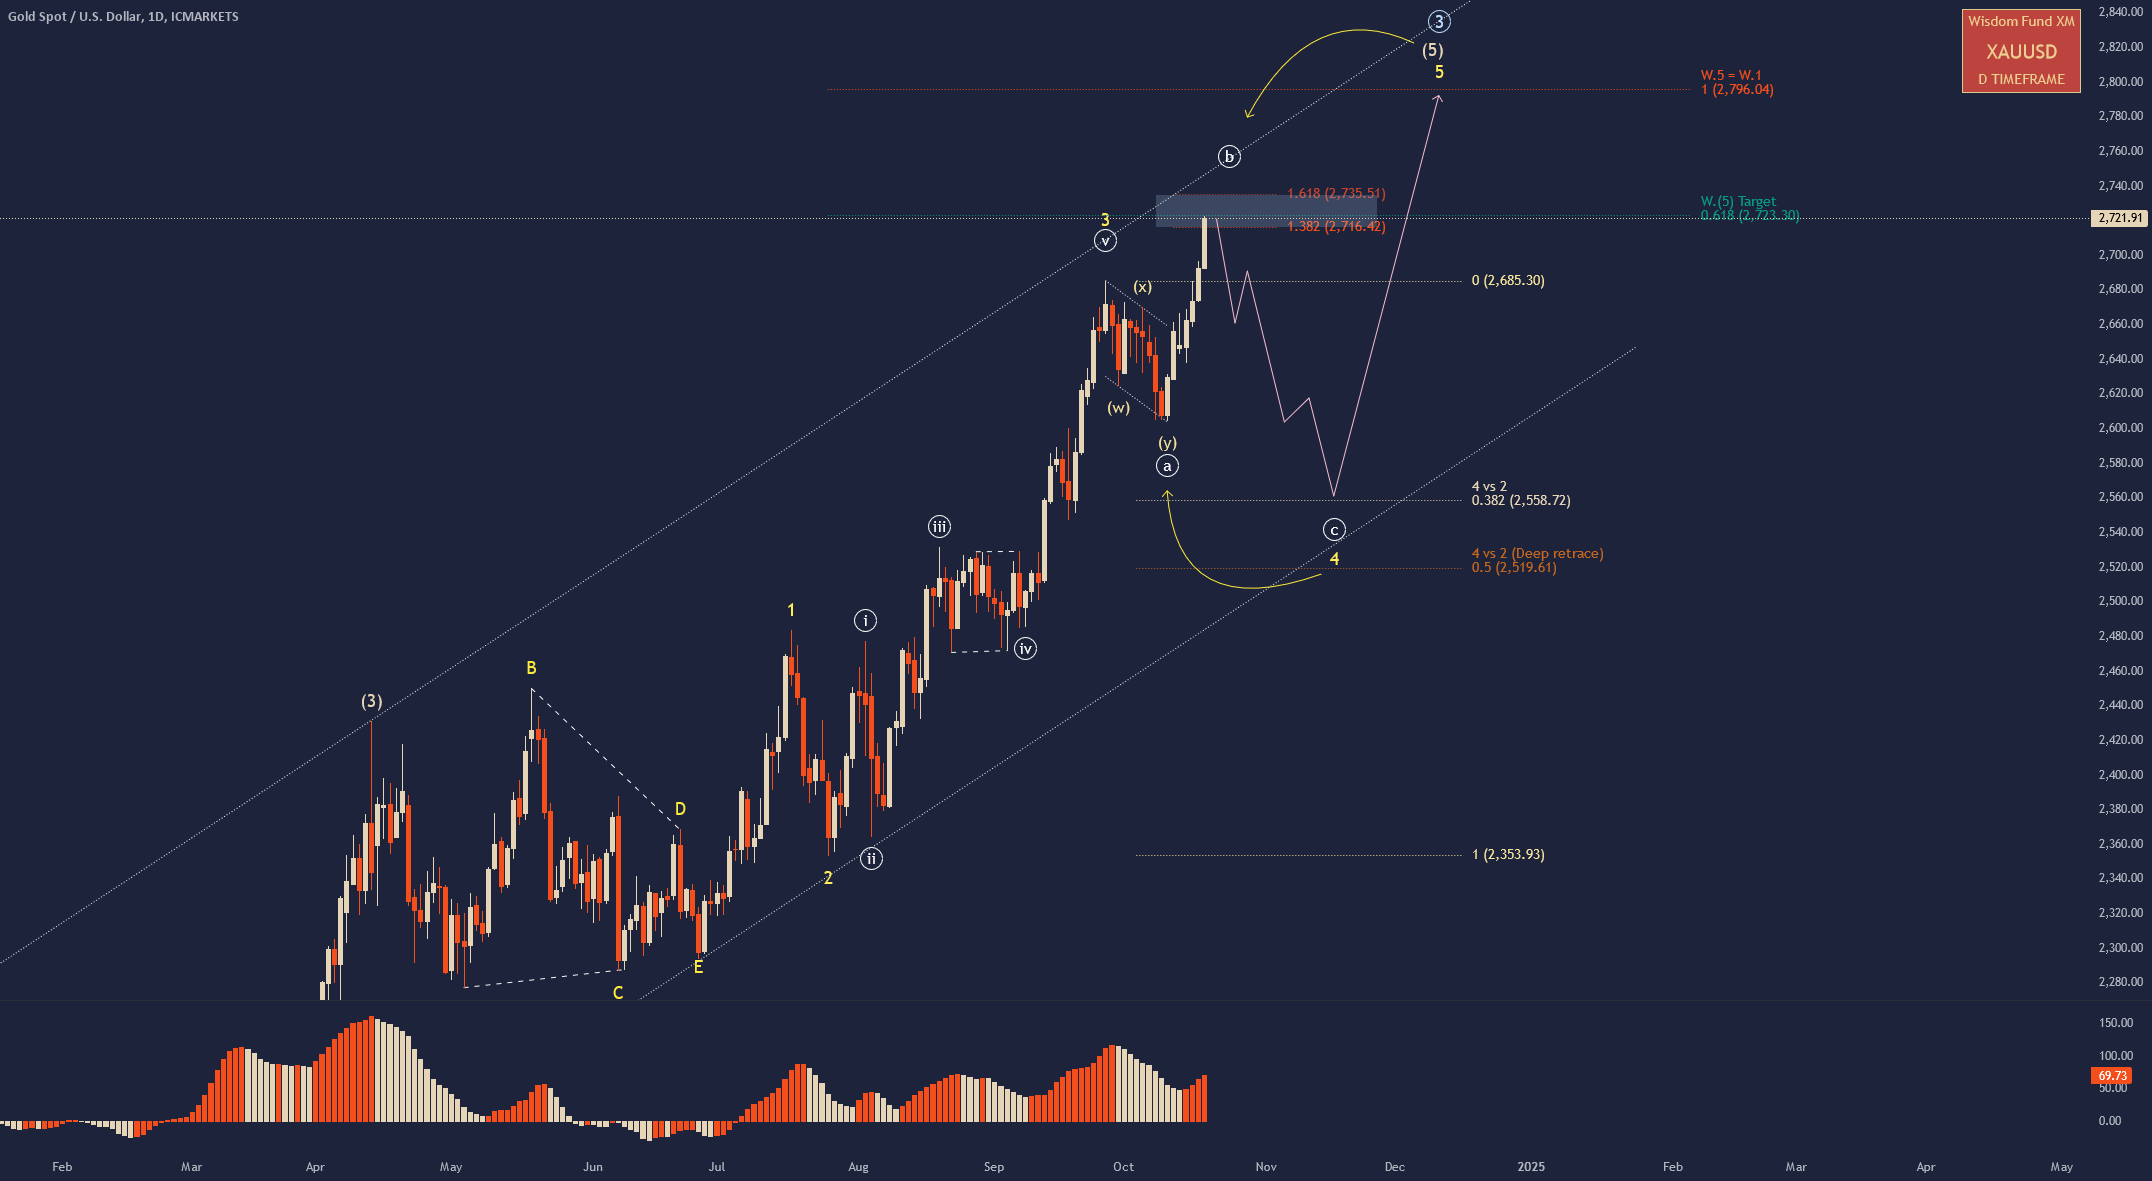
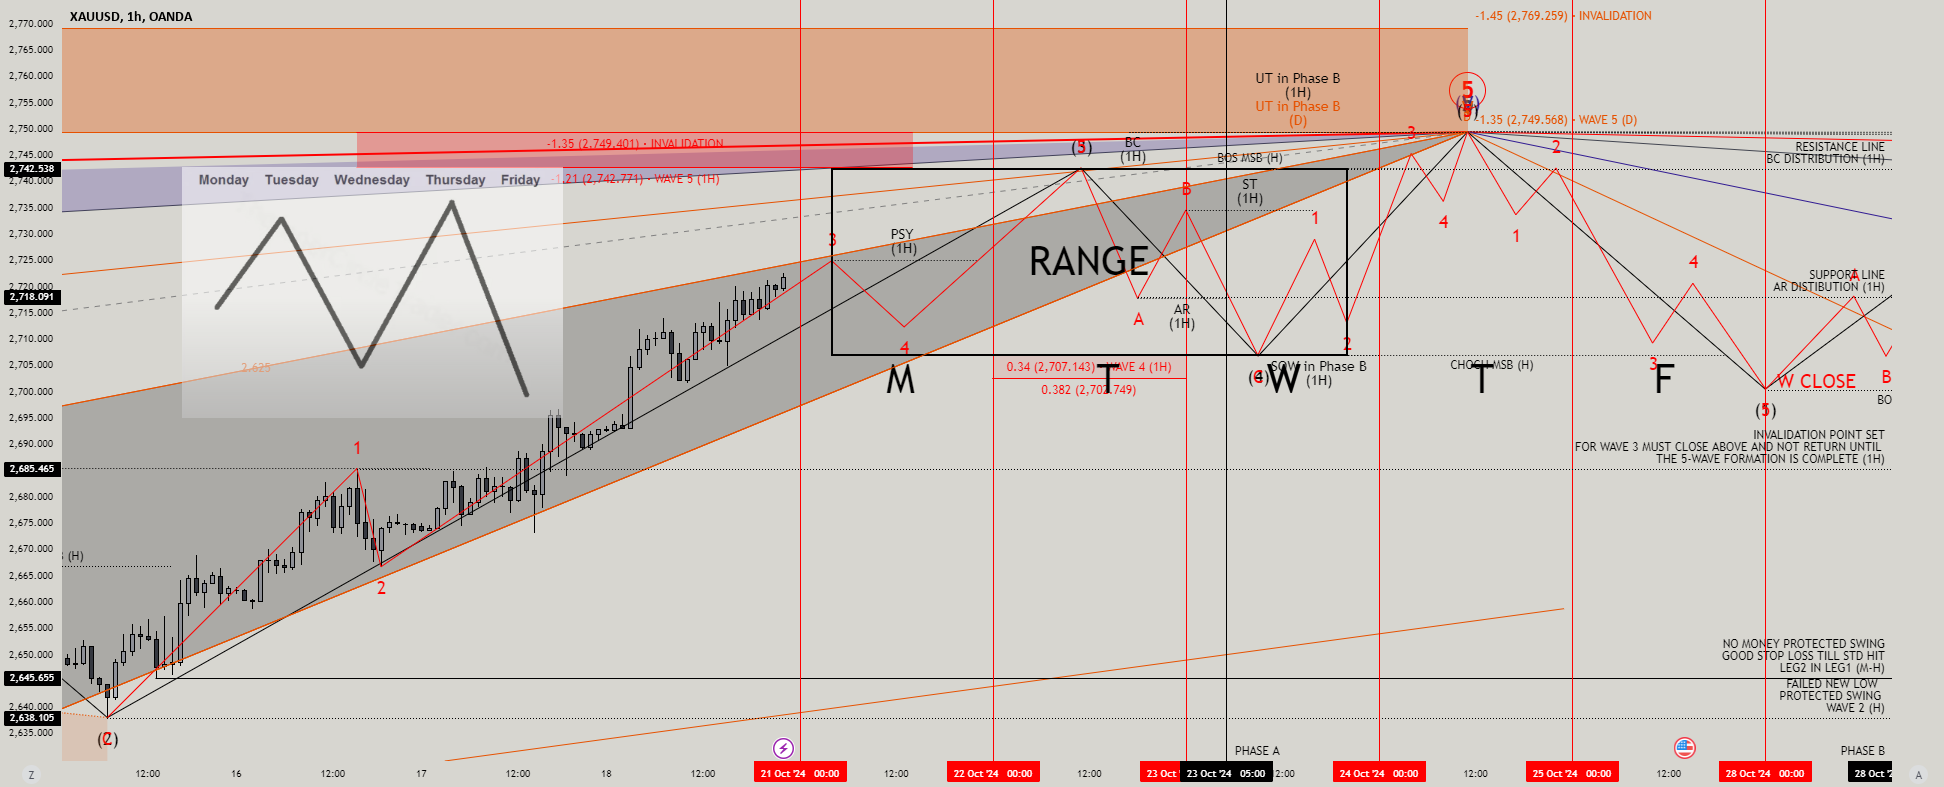
XAUUSD (Gold) Continues to Reach New All-Time HighsGold prices have been surging aggressively over the past week.At present, gold appears to be forming one of two potential patterns:In the correction
Forex prop trading (short for foreign exchange proprietary trading) refers to a trading model where traders use capital provided by a proprietary trading firm to trade in the Forex (foreign
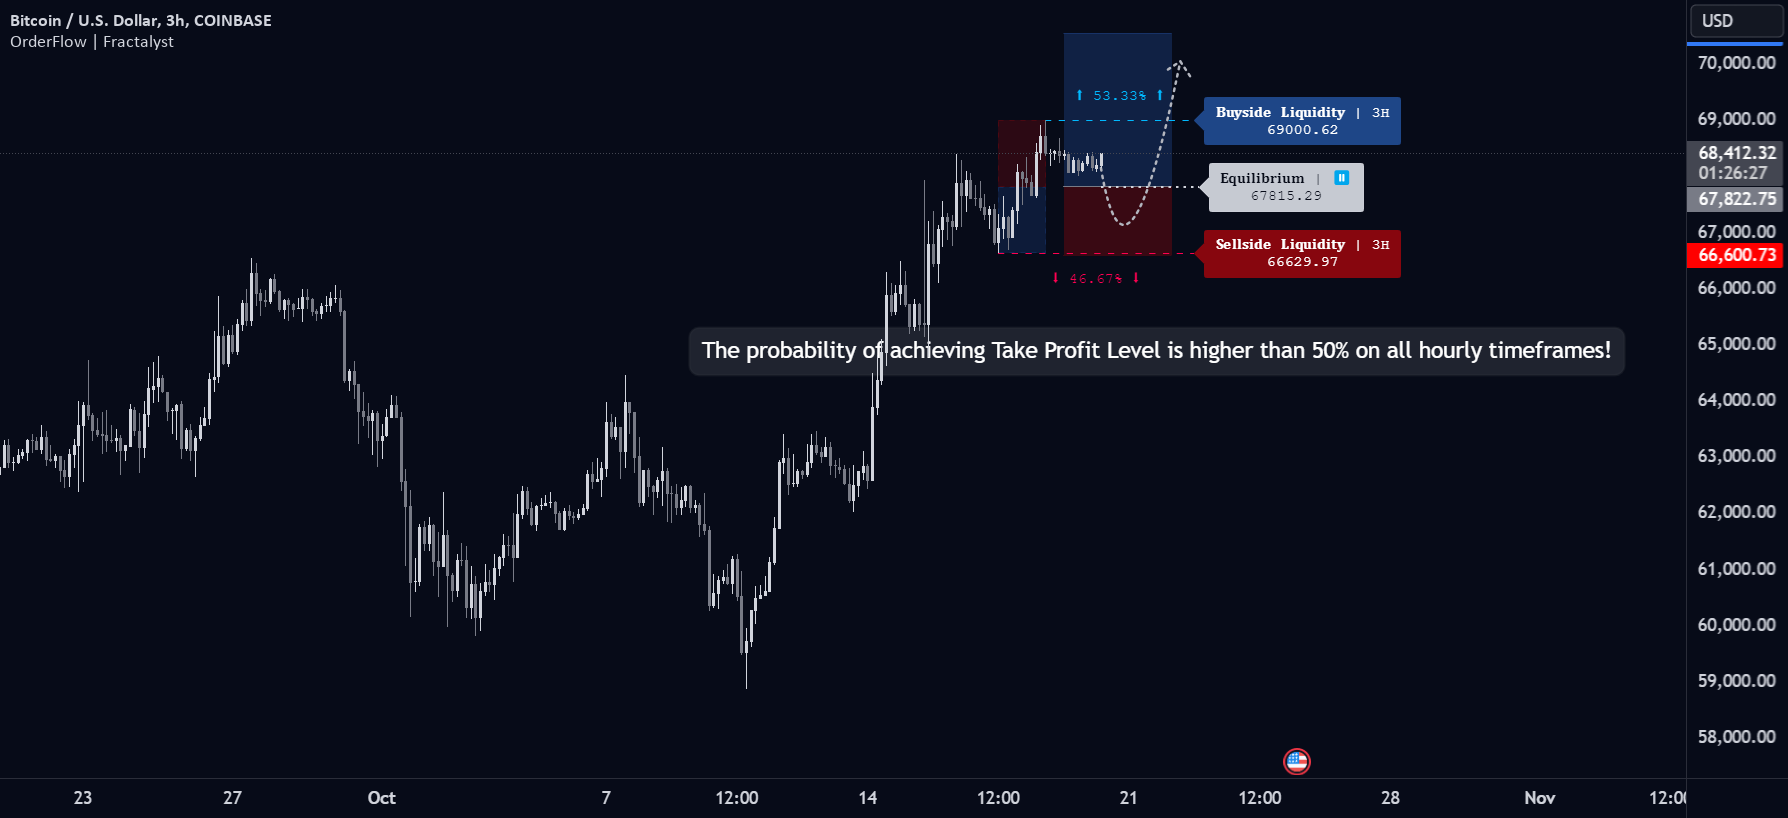
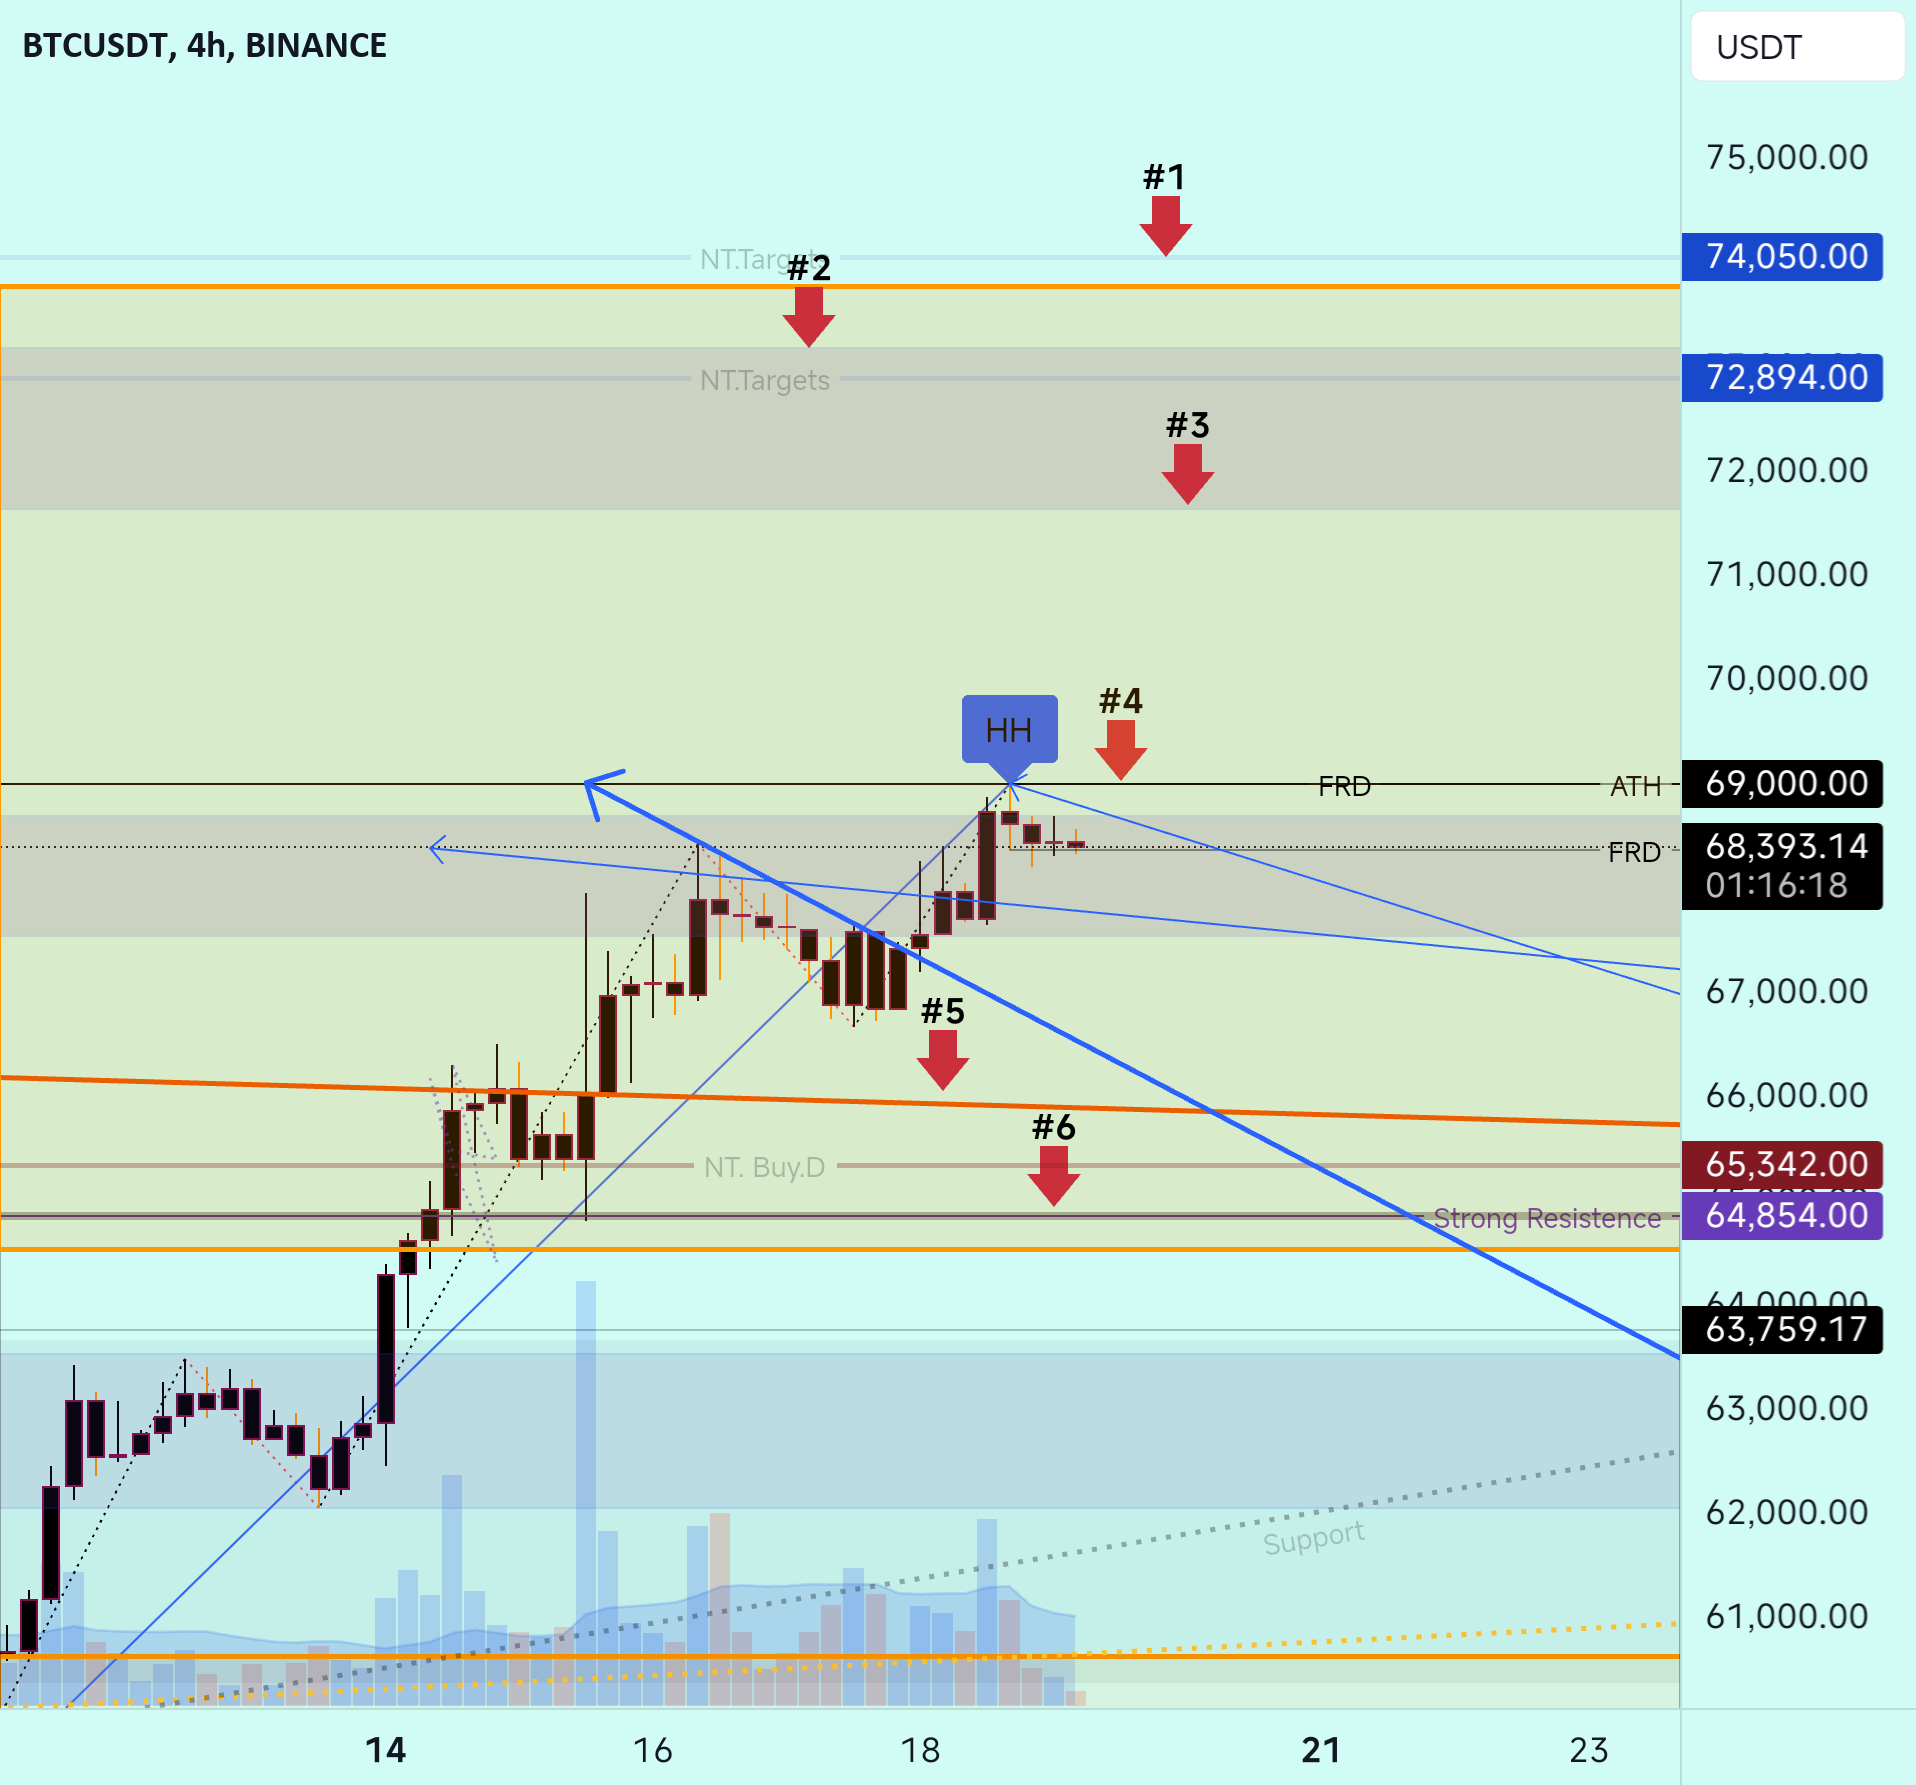
My sentiment about BTCUSD is firmly bullish. I plan to utilize probabilities to strategically position myself into long positions. This approach allows me to leverage statistical analysis and market behavior
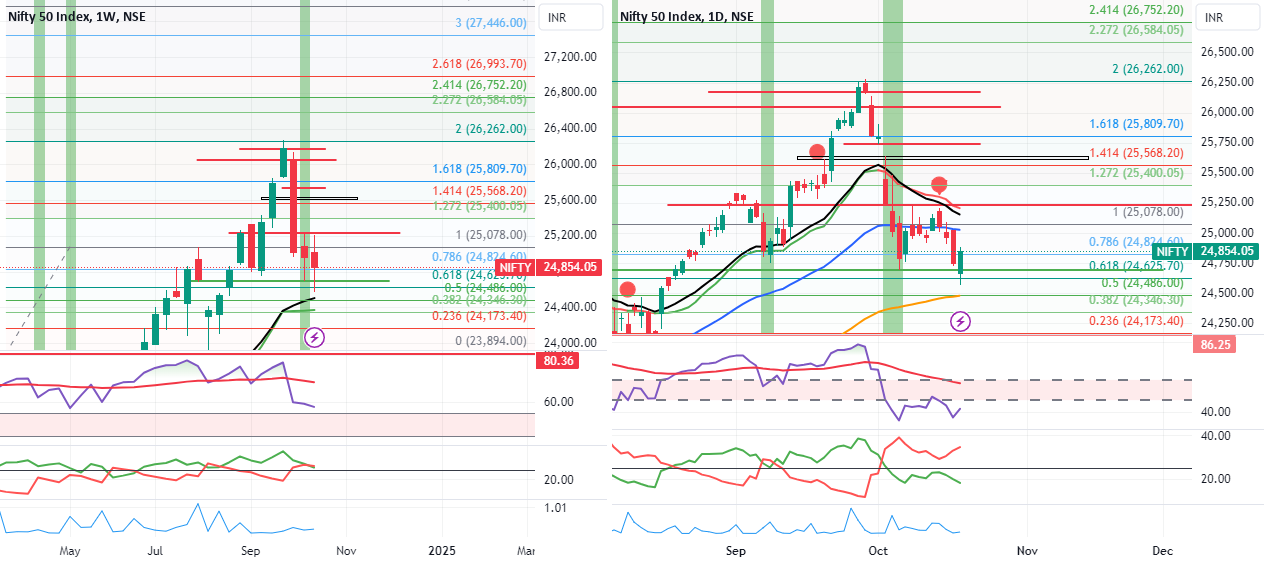
The Nifty 50 index concluded the week at 24,854, a 110-point decline from the previous week's close. Despite hitting a high of 25,212 and a low of 24,567, the index
1. Elliott Wave Theory: Wave AnalysisWave 5 Completion (Top of Impulsive Move):End of Wave 5 marks the peak of the bullish phase, followed by a corrective move (ABC correction).Wave 5
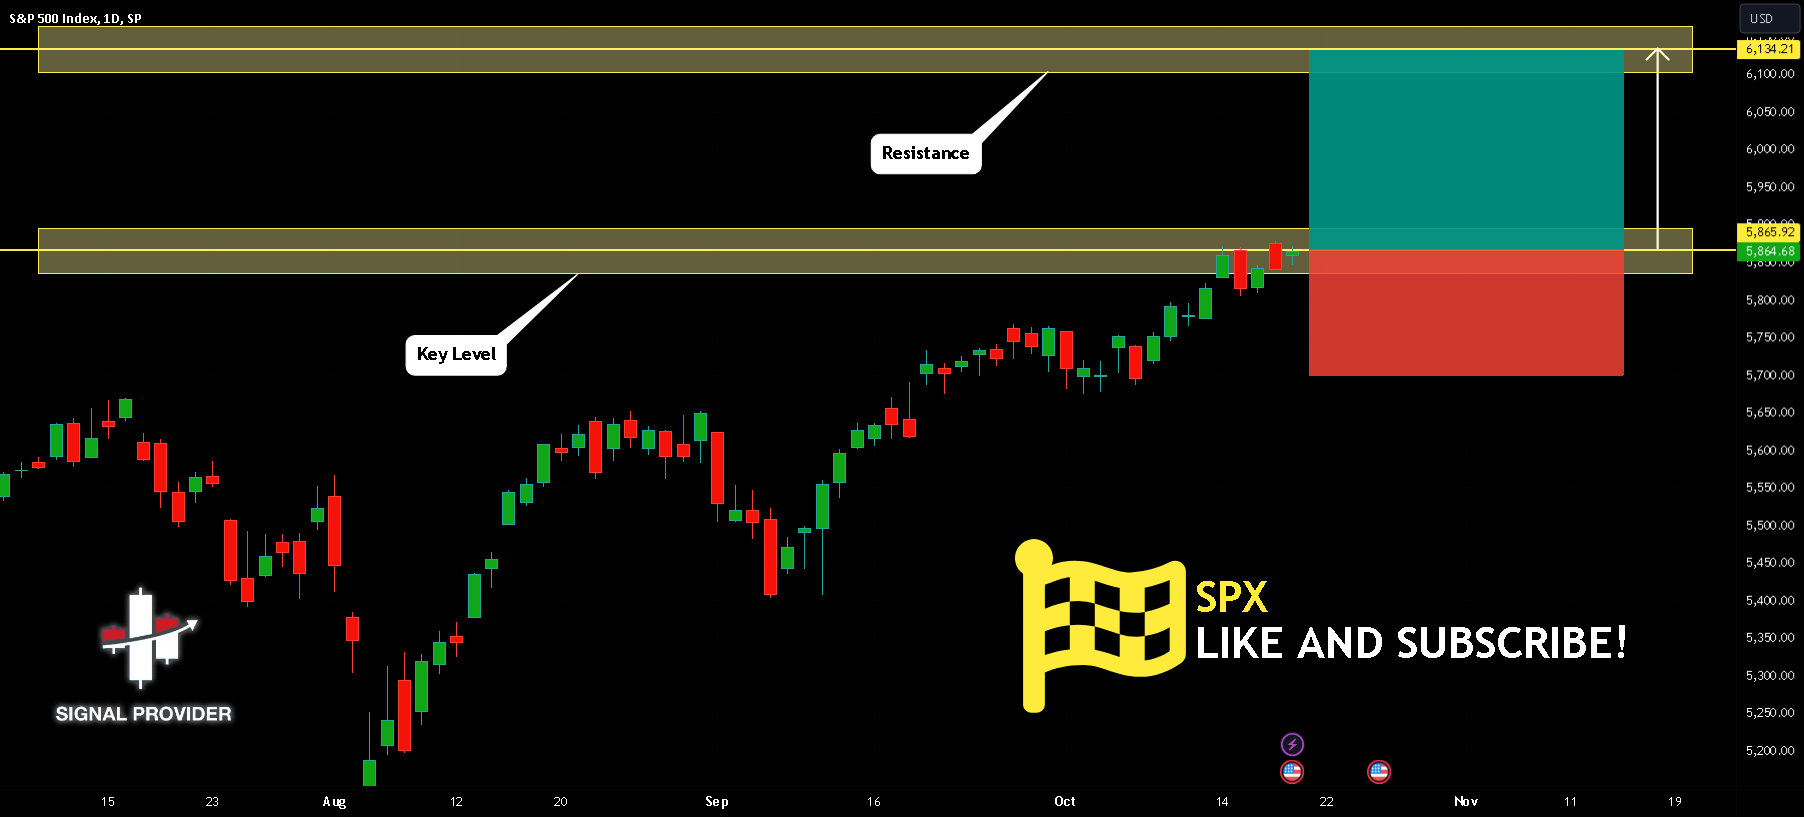
Take a look at our analysis for SPX.Time Frame: 1DCurrent Trend: BullishSentiment: Oversold (based on 7-period RSI) Forecast: BullishThe market is trading around a solid horizontal structure 5,865.92.The above observations
As-salamu alaykum and Good Morning to All Brothers and Sisters!#Bitcoin has followed every step just as predicted in my last analysis, Alhamdulillah! We’ve successfully broken through all the key resistance
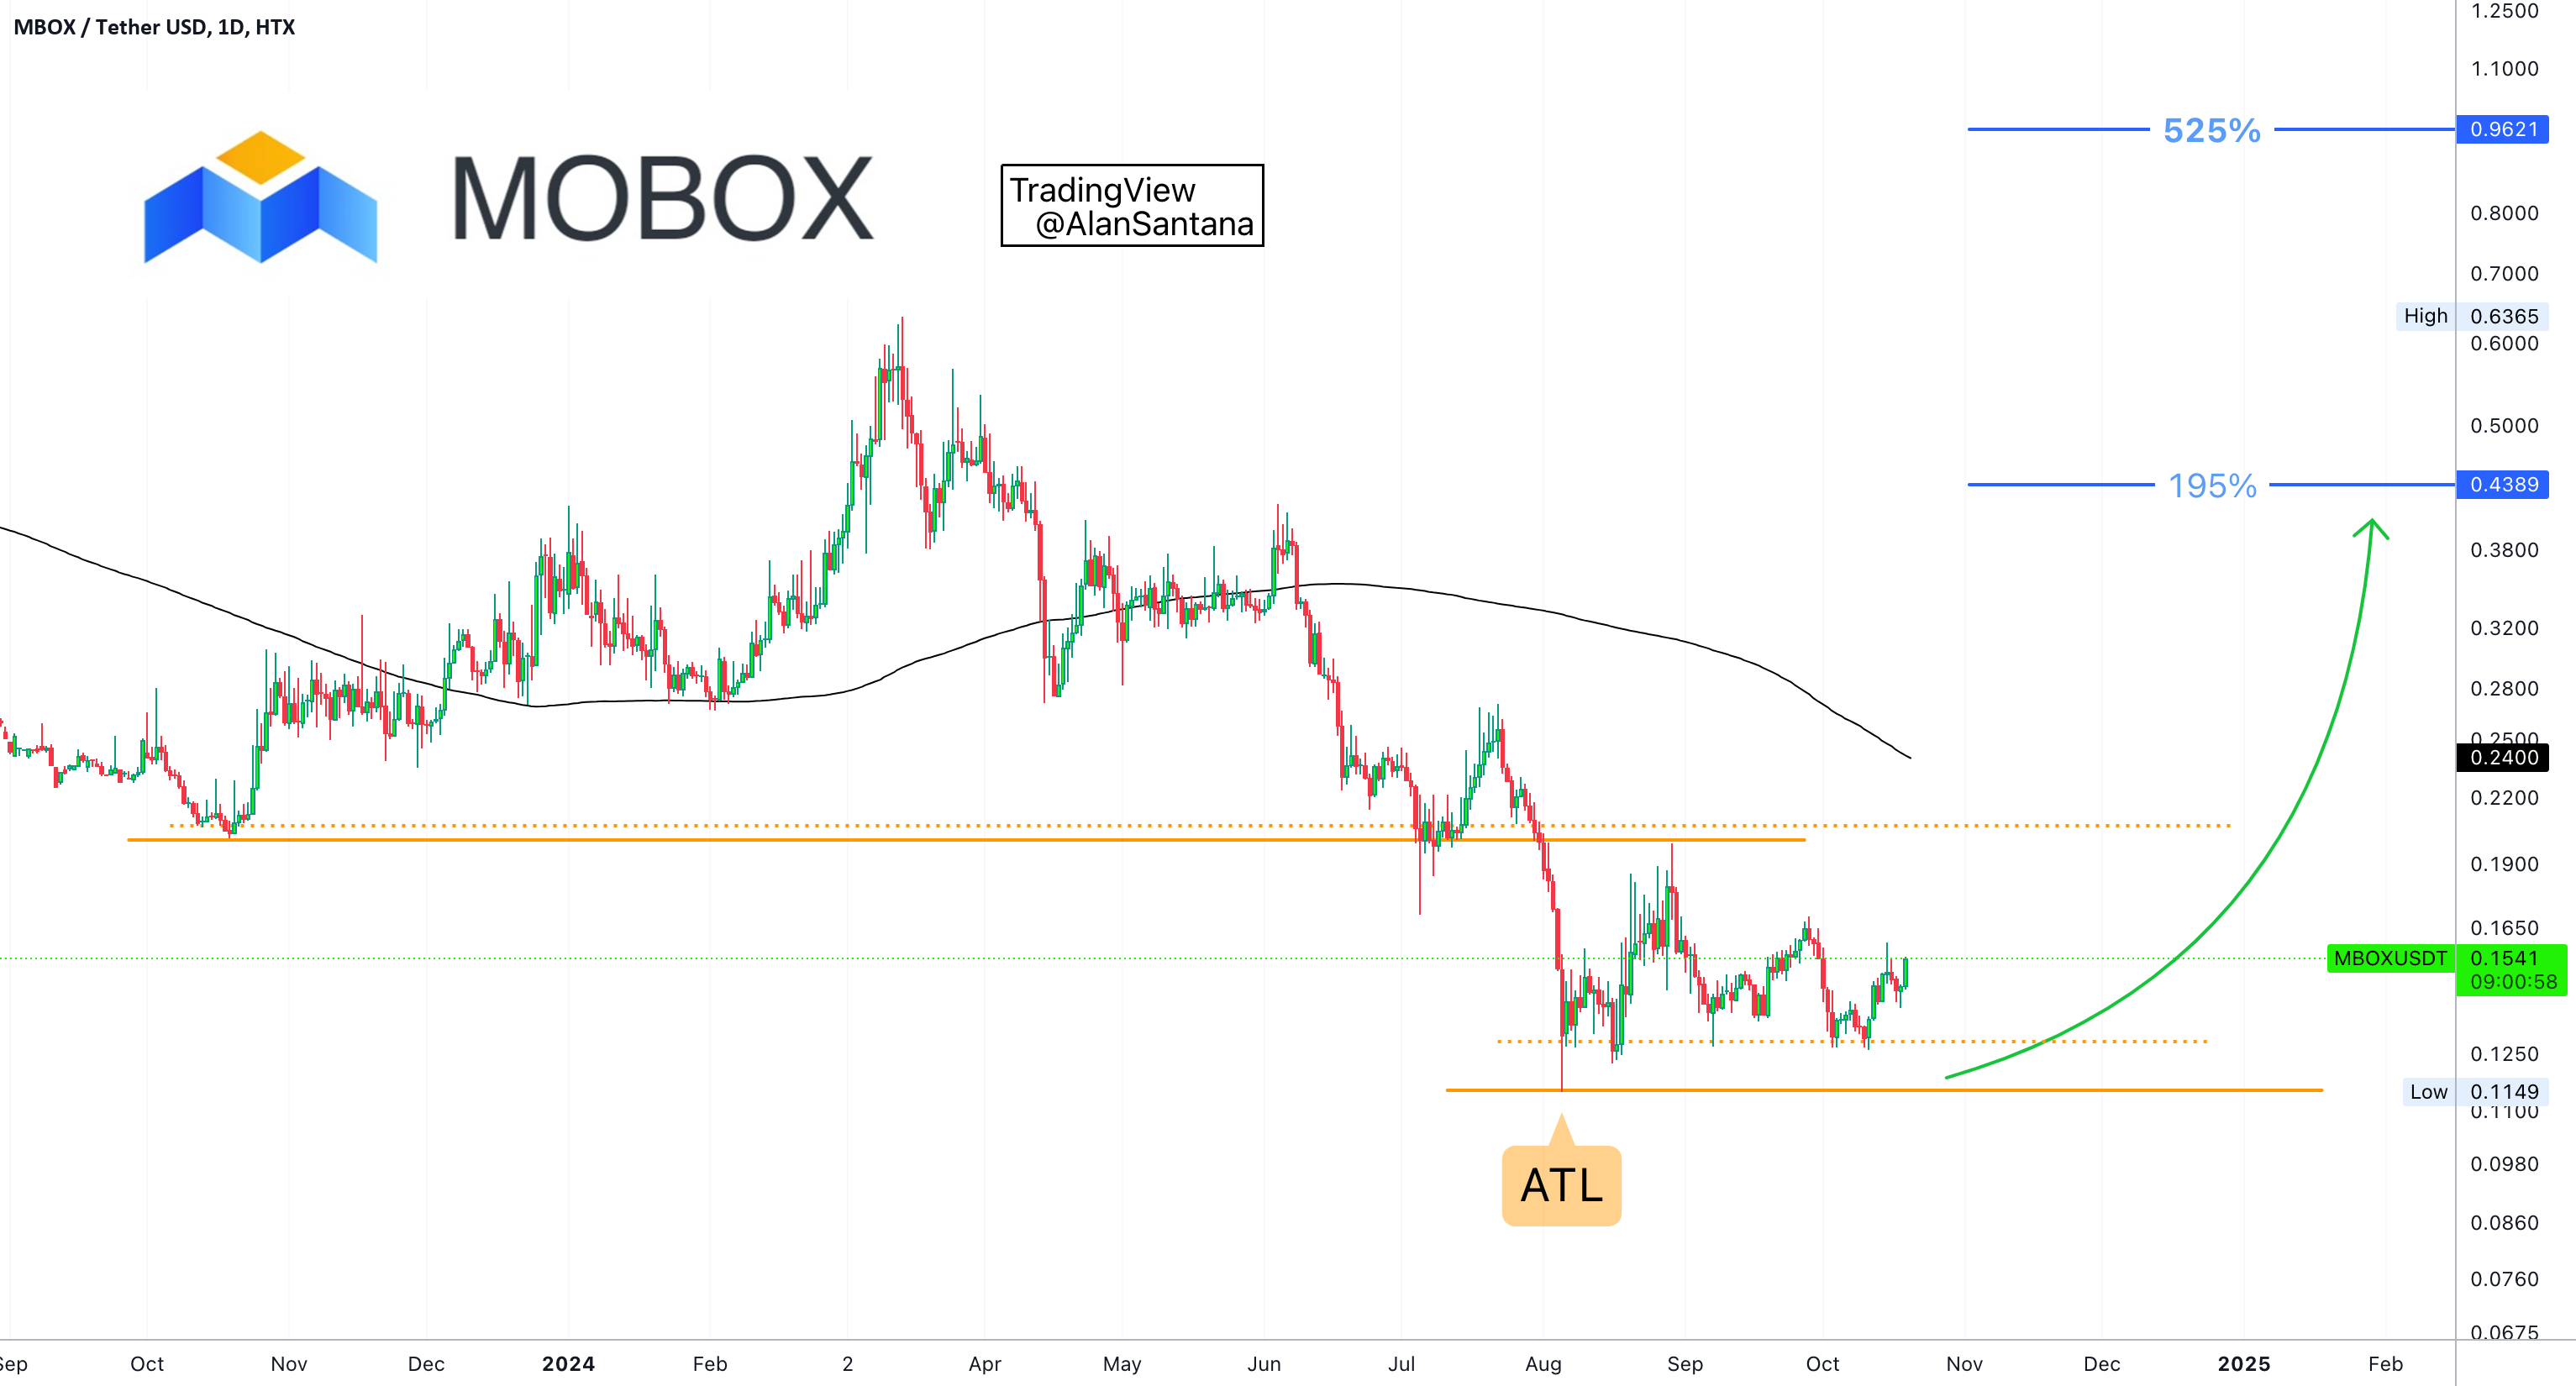
Here we have MBOXUSDT, it has the same pattern as many other pairs but with the difference that the 5-August drop produced a true bottom, an All-Time Low.This is a
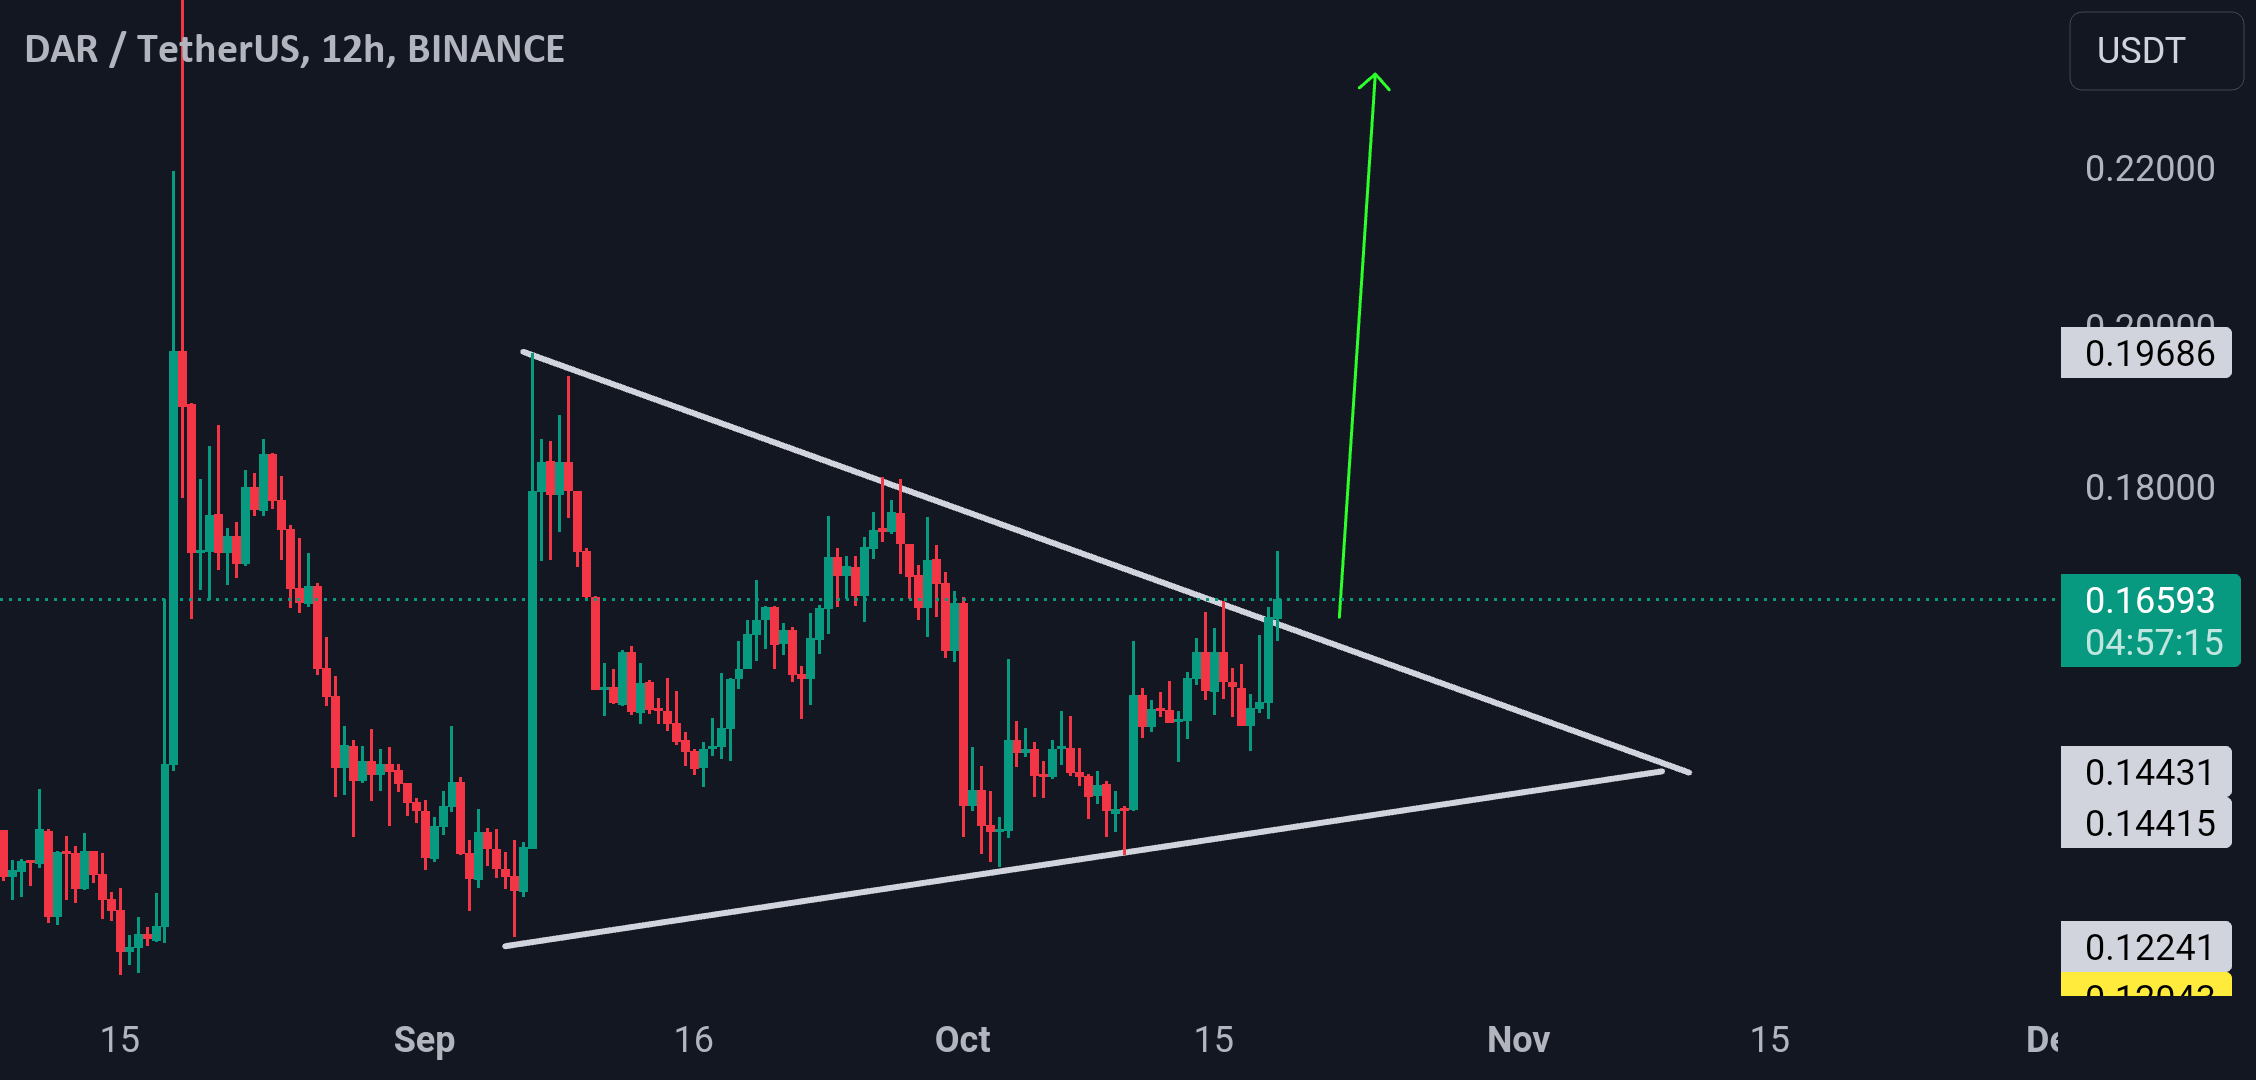
DAR/USDT is showing potential for a breakout from a symmetrical triangle pattern on the 12-hour time frame. A solid breakout could happen soon. If the price breaks out and successfully