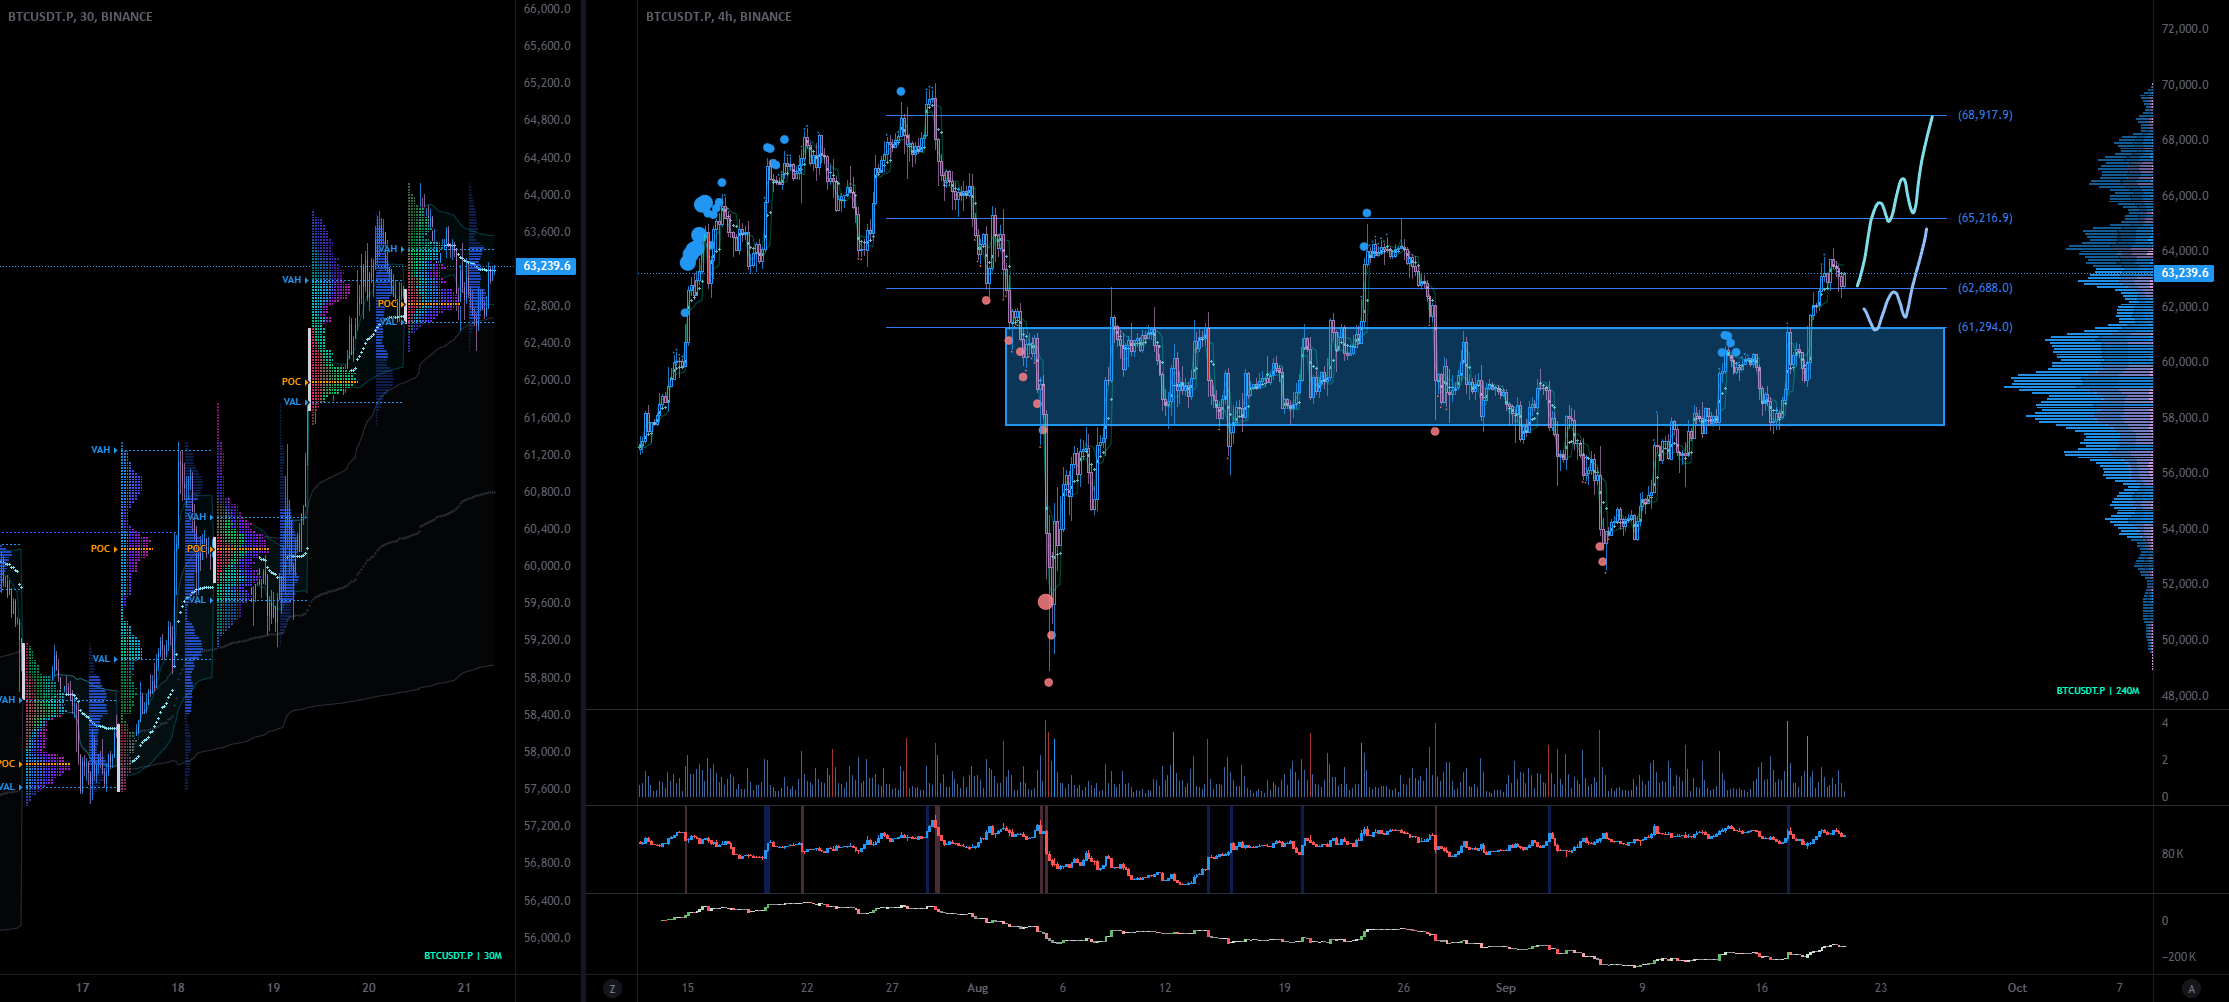
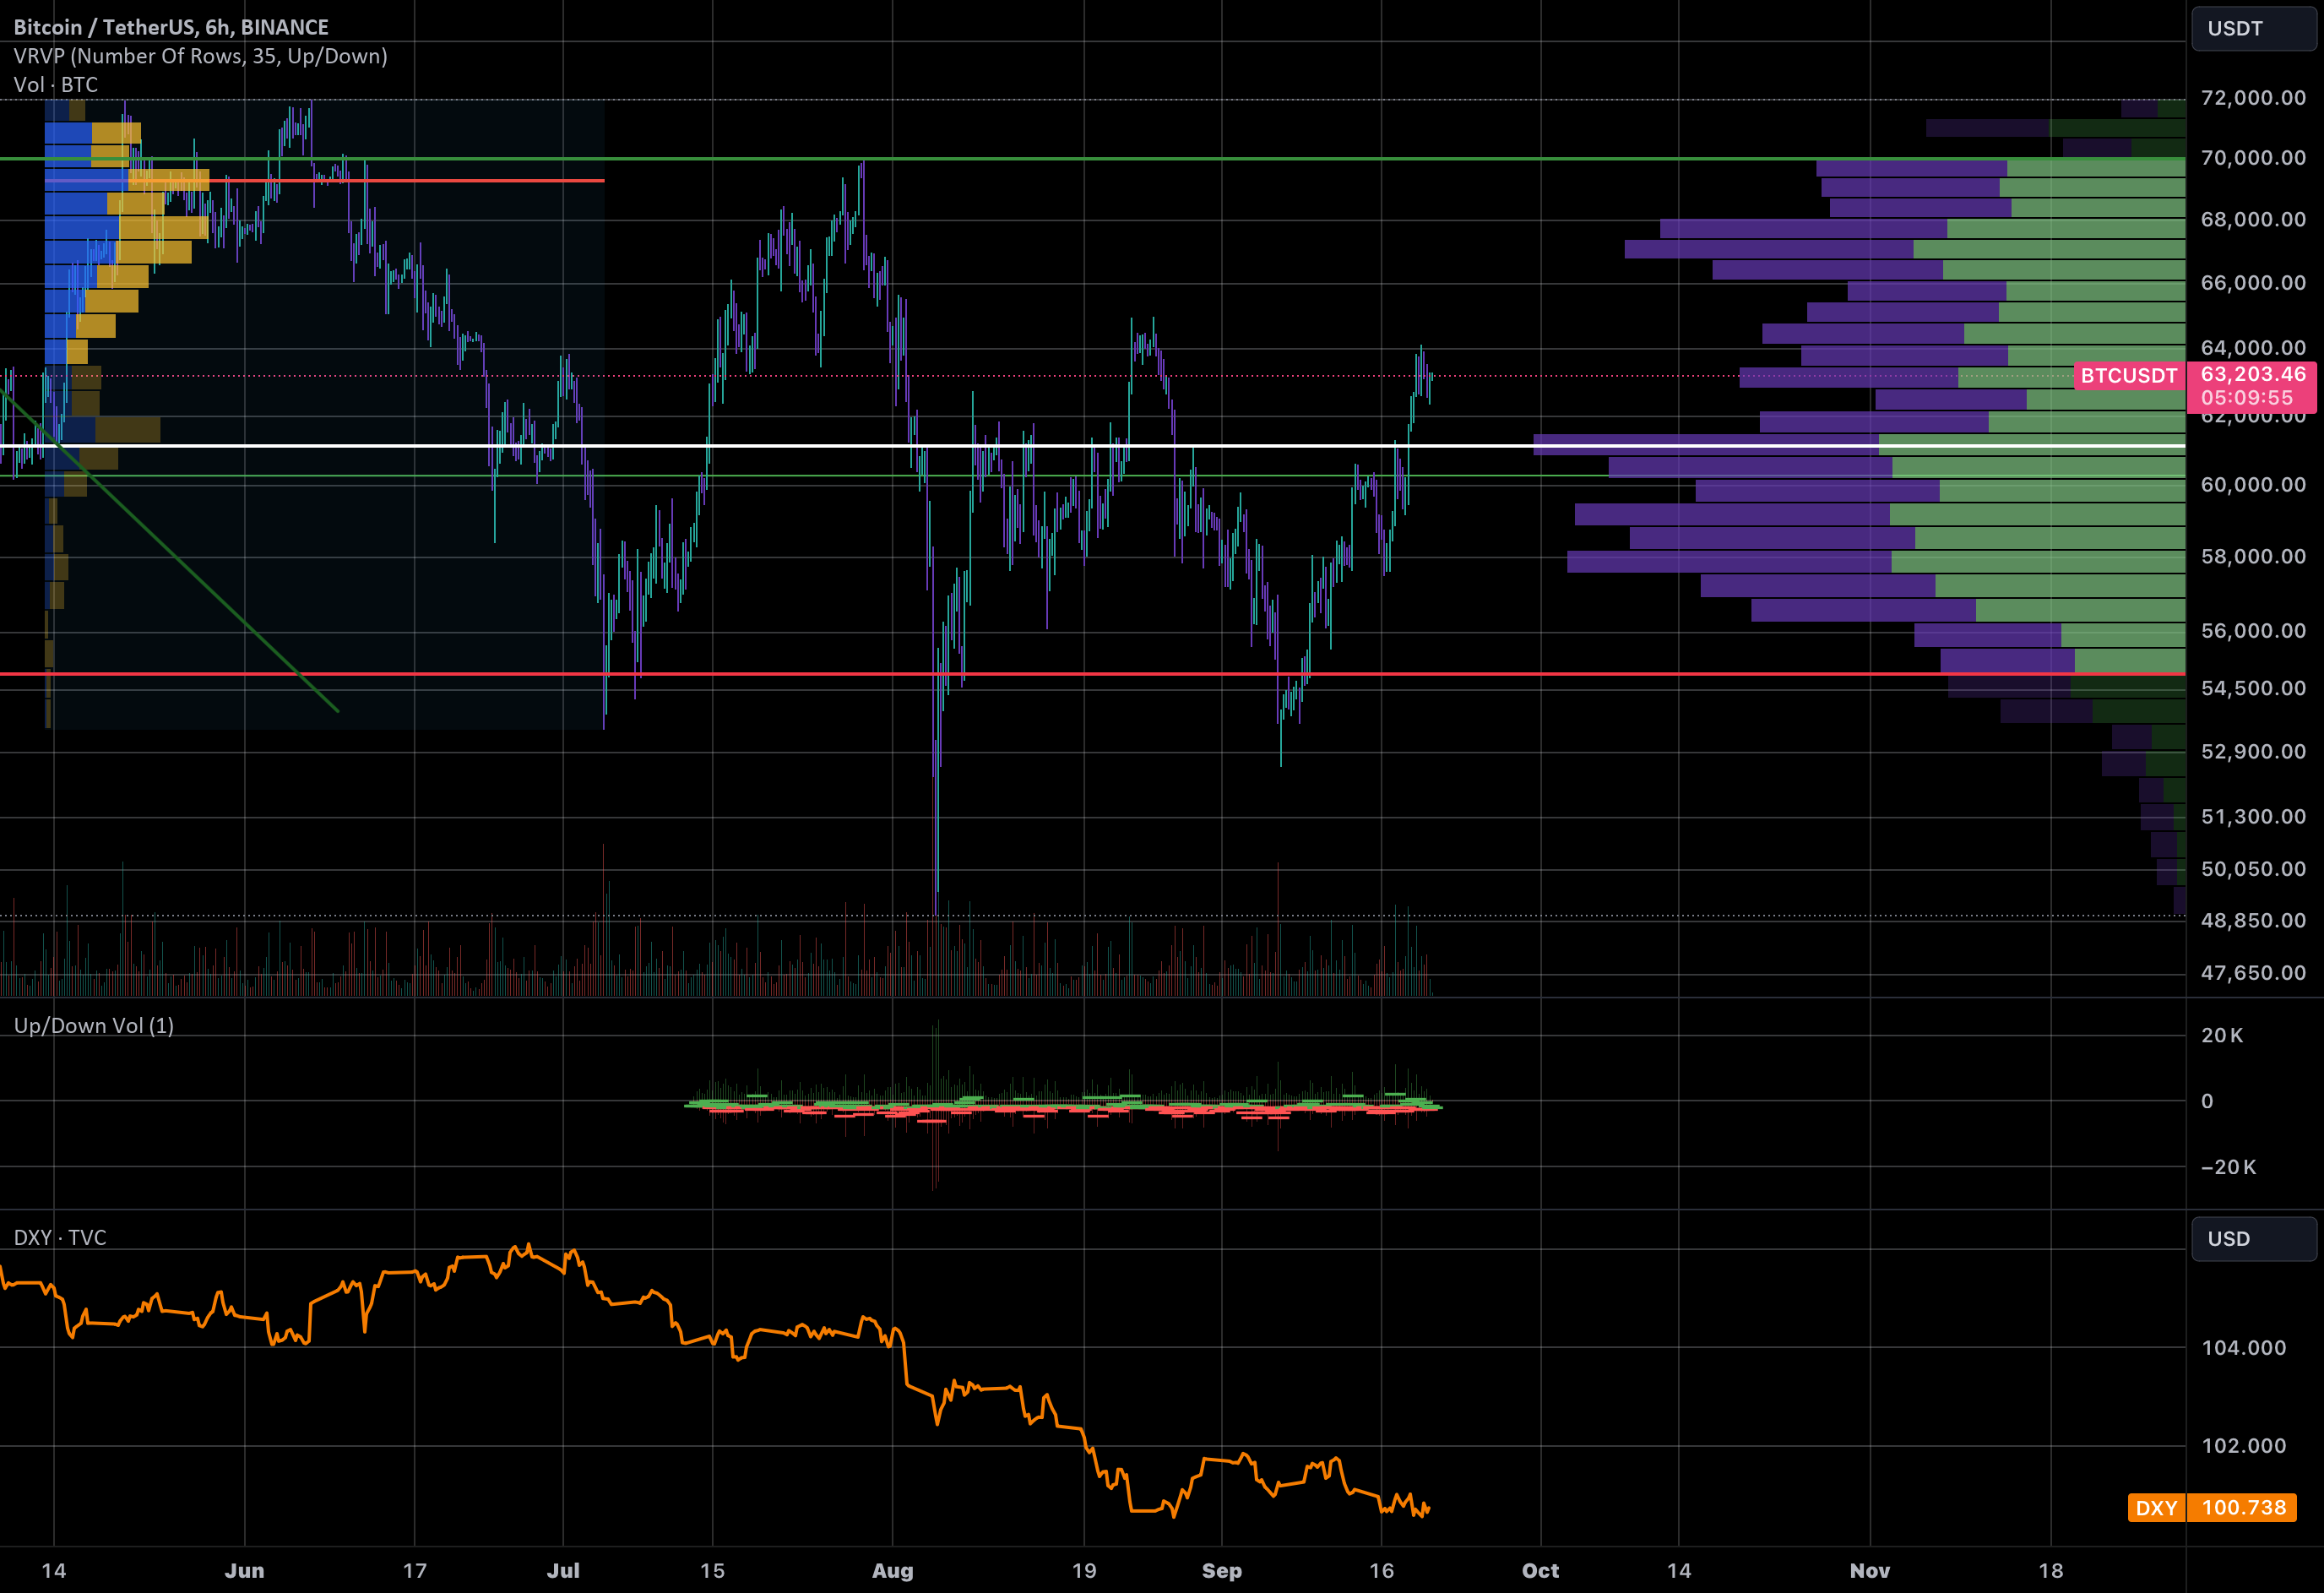
For 6 months Bitcoin has been in a downtrend making consecutive lower highsPrice stalls above $60,000, and if we get any pullback, I believe the support level that has to
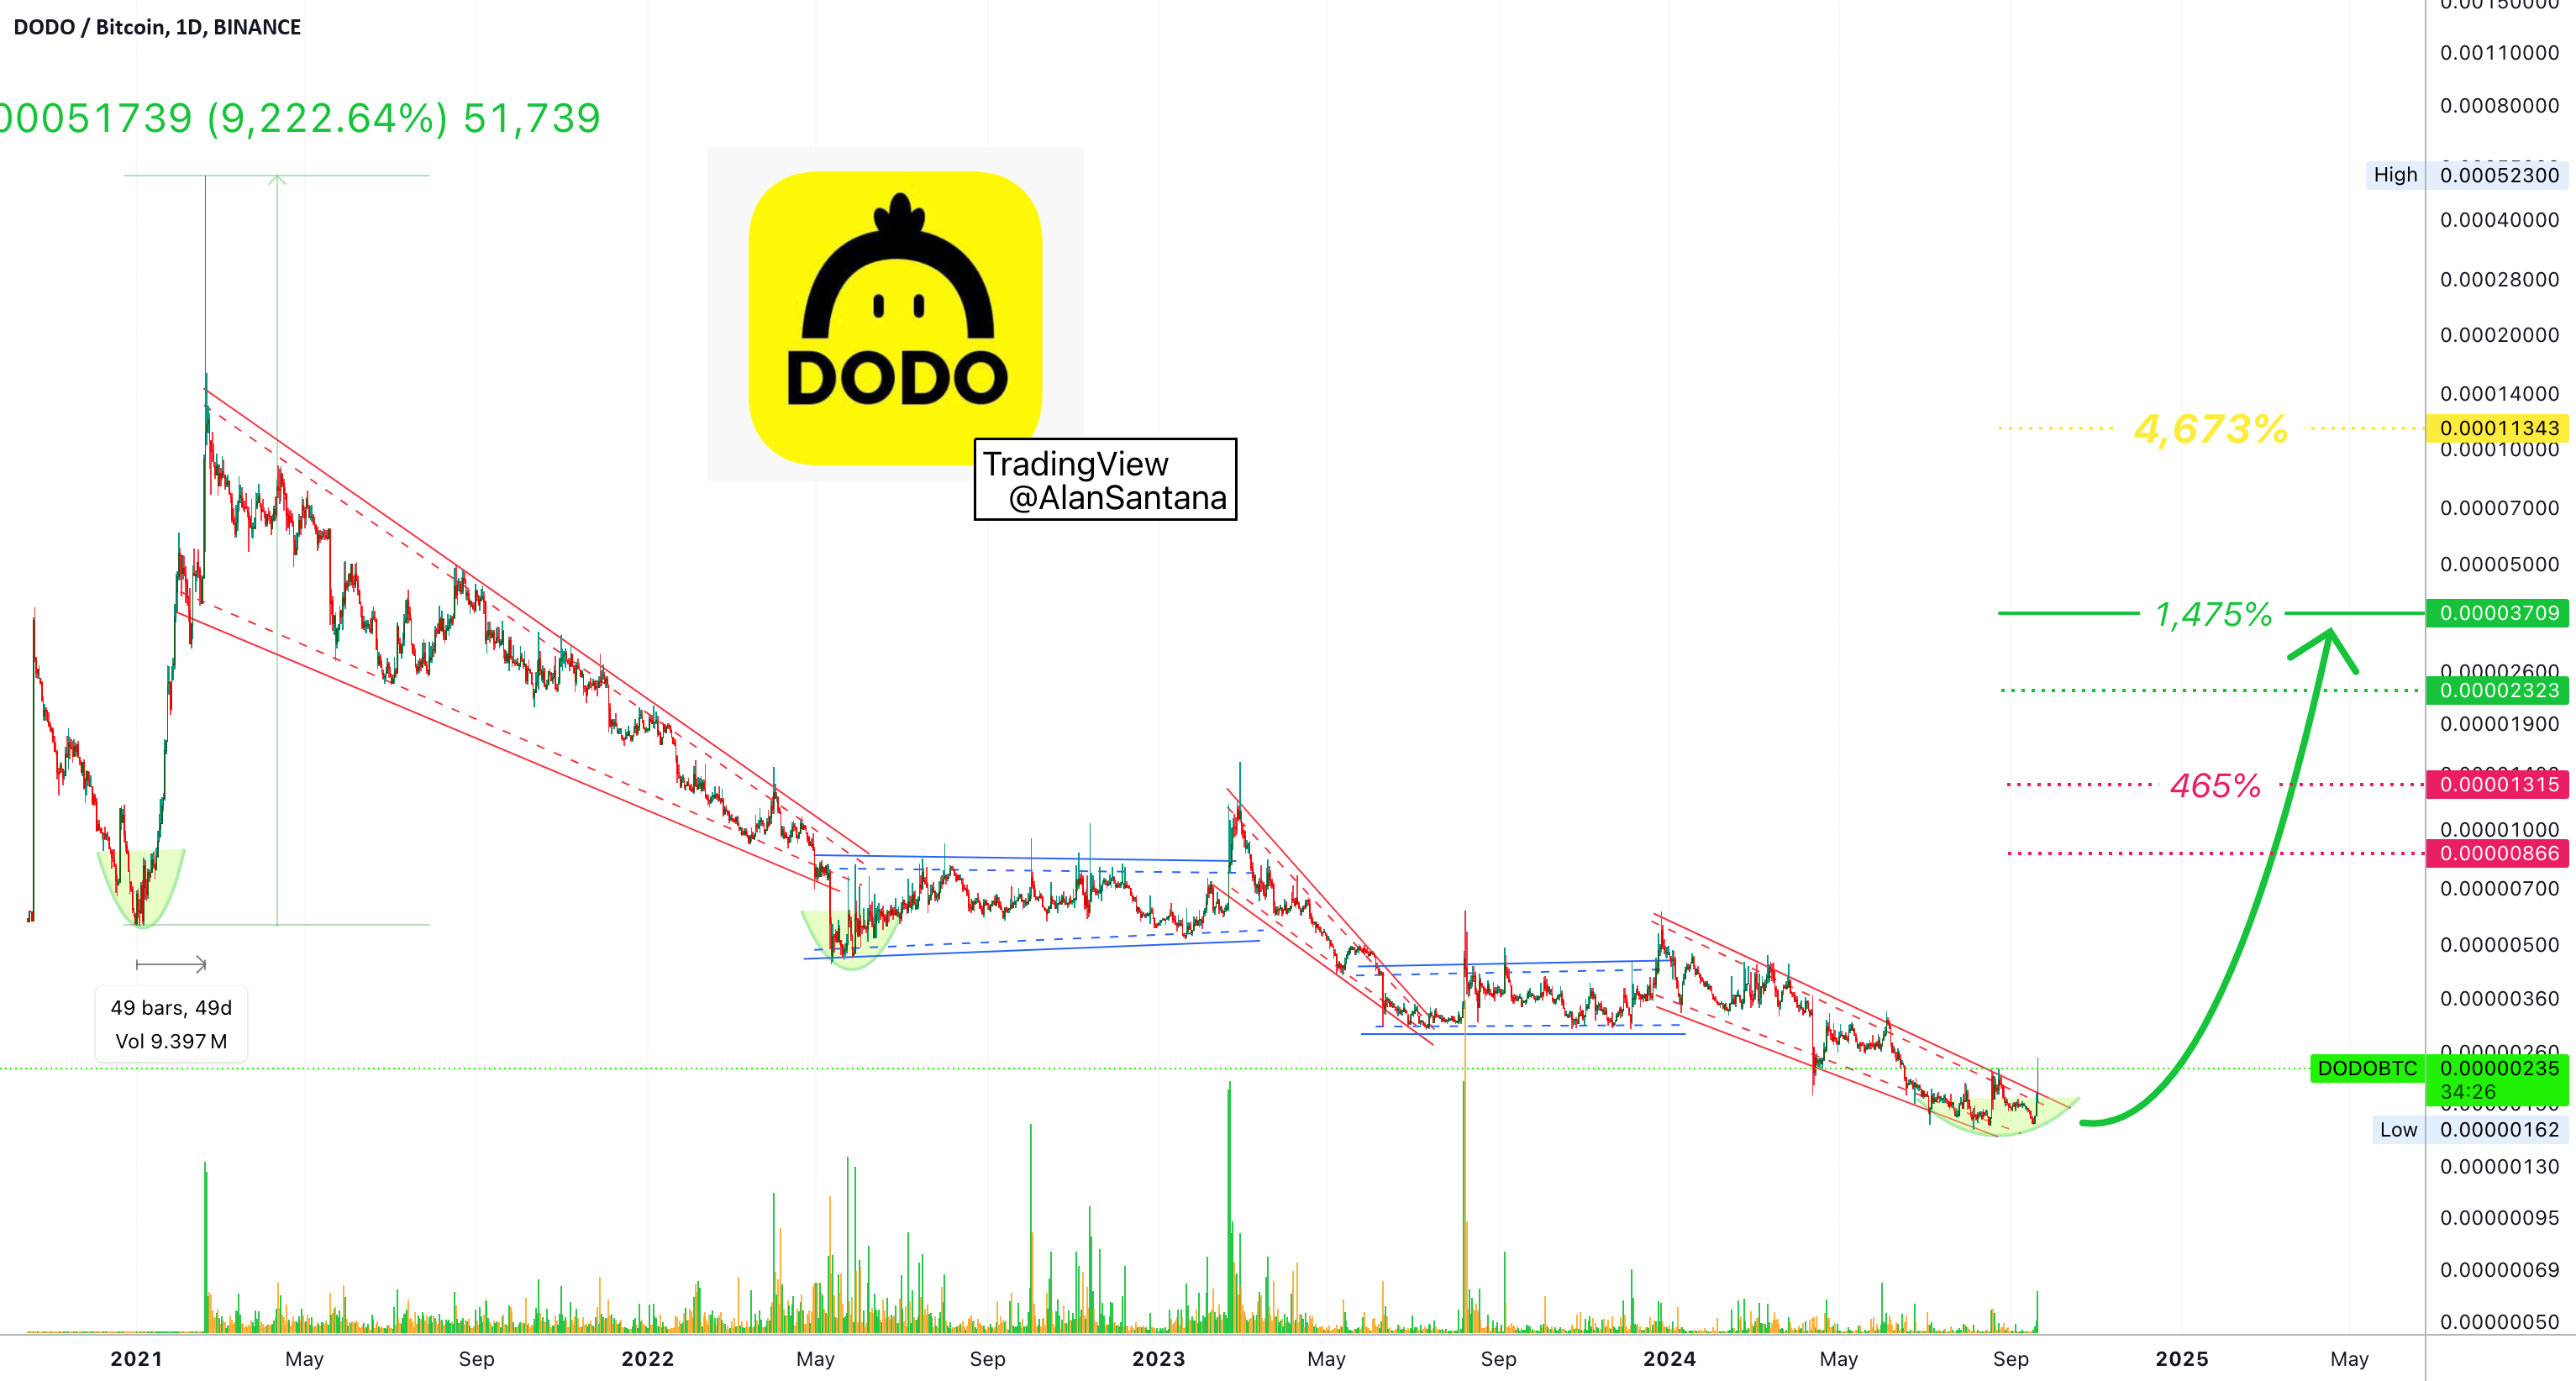
Hello my dear Cryptocurrency buyer, let's diagnose this chart together and distill what it means to us and the Altcoins market.We are looking at DODOBTC long-term, on the daily timeframe.The
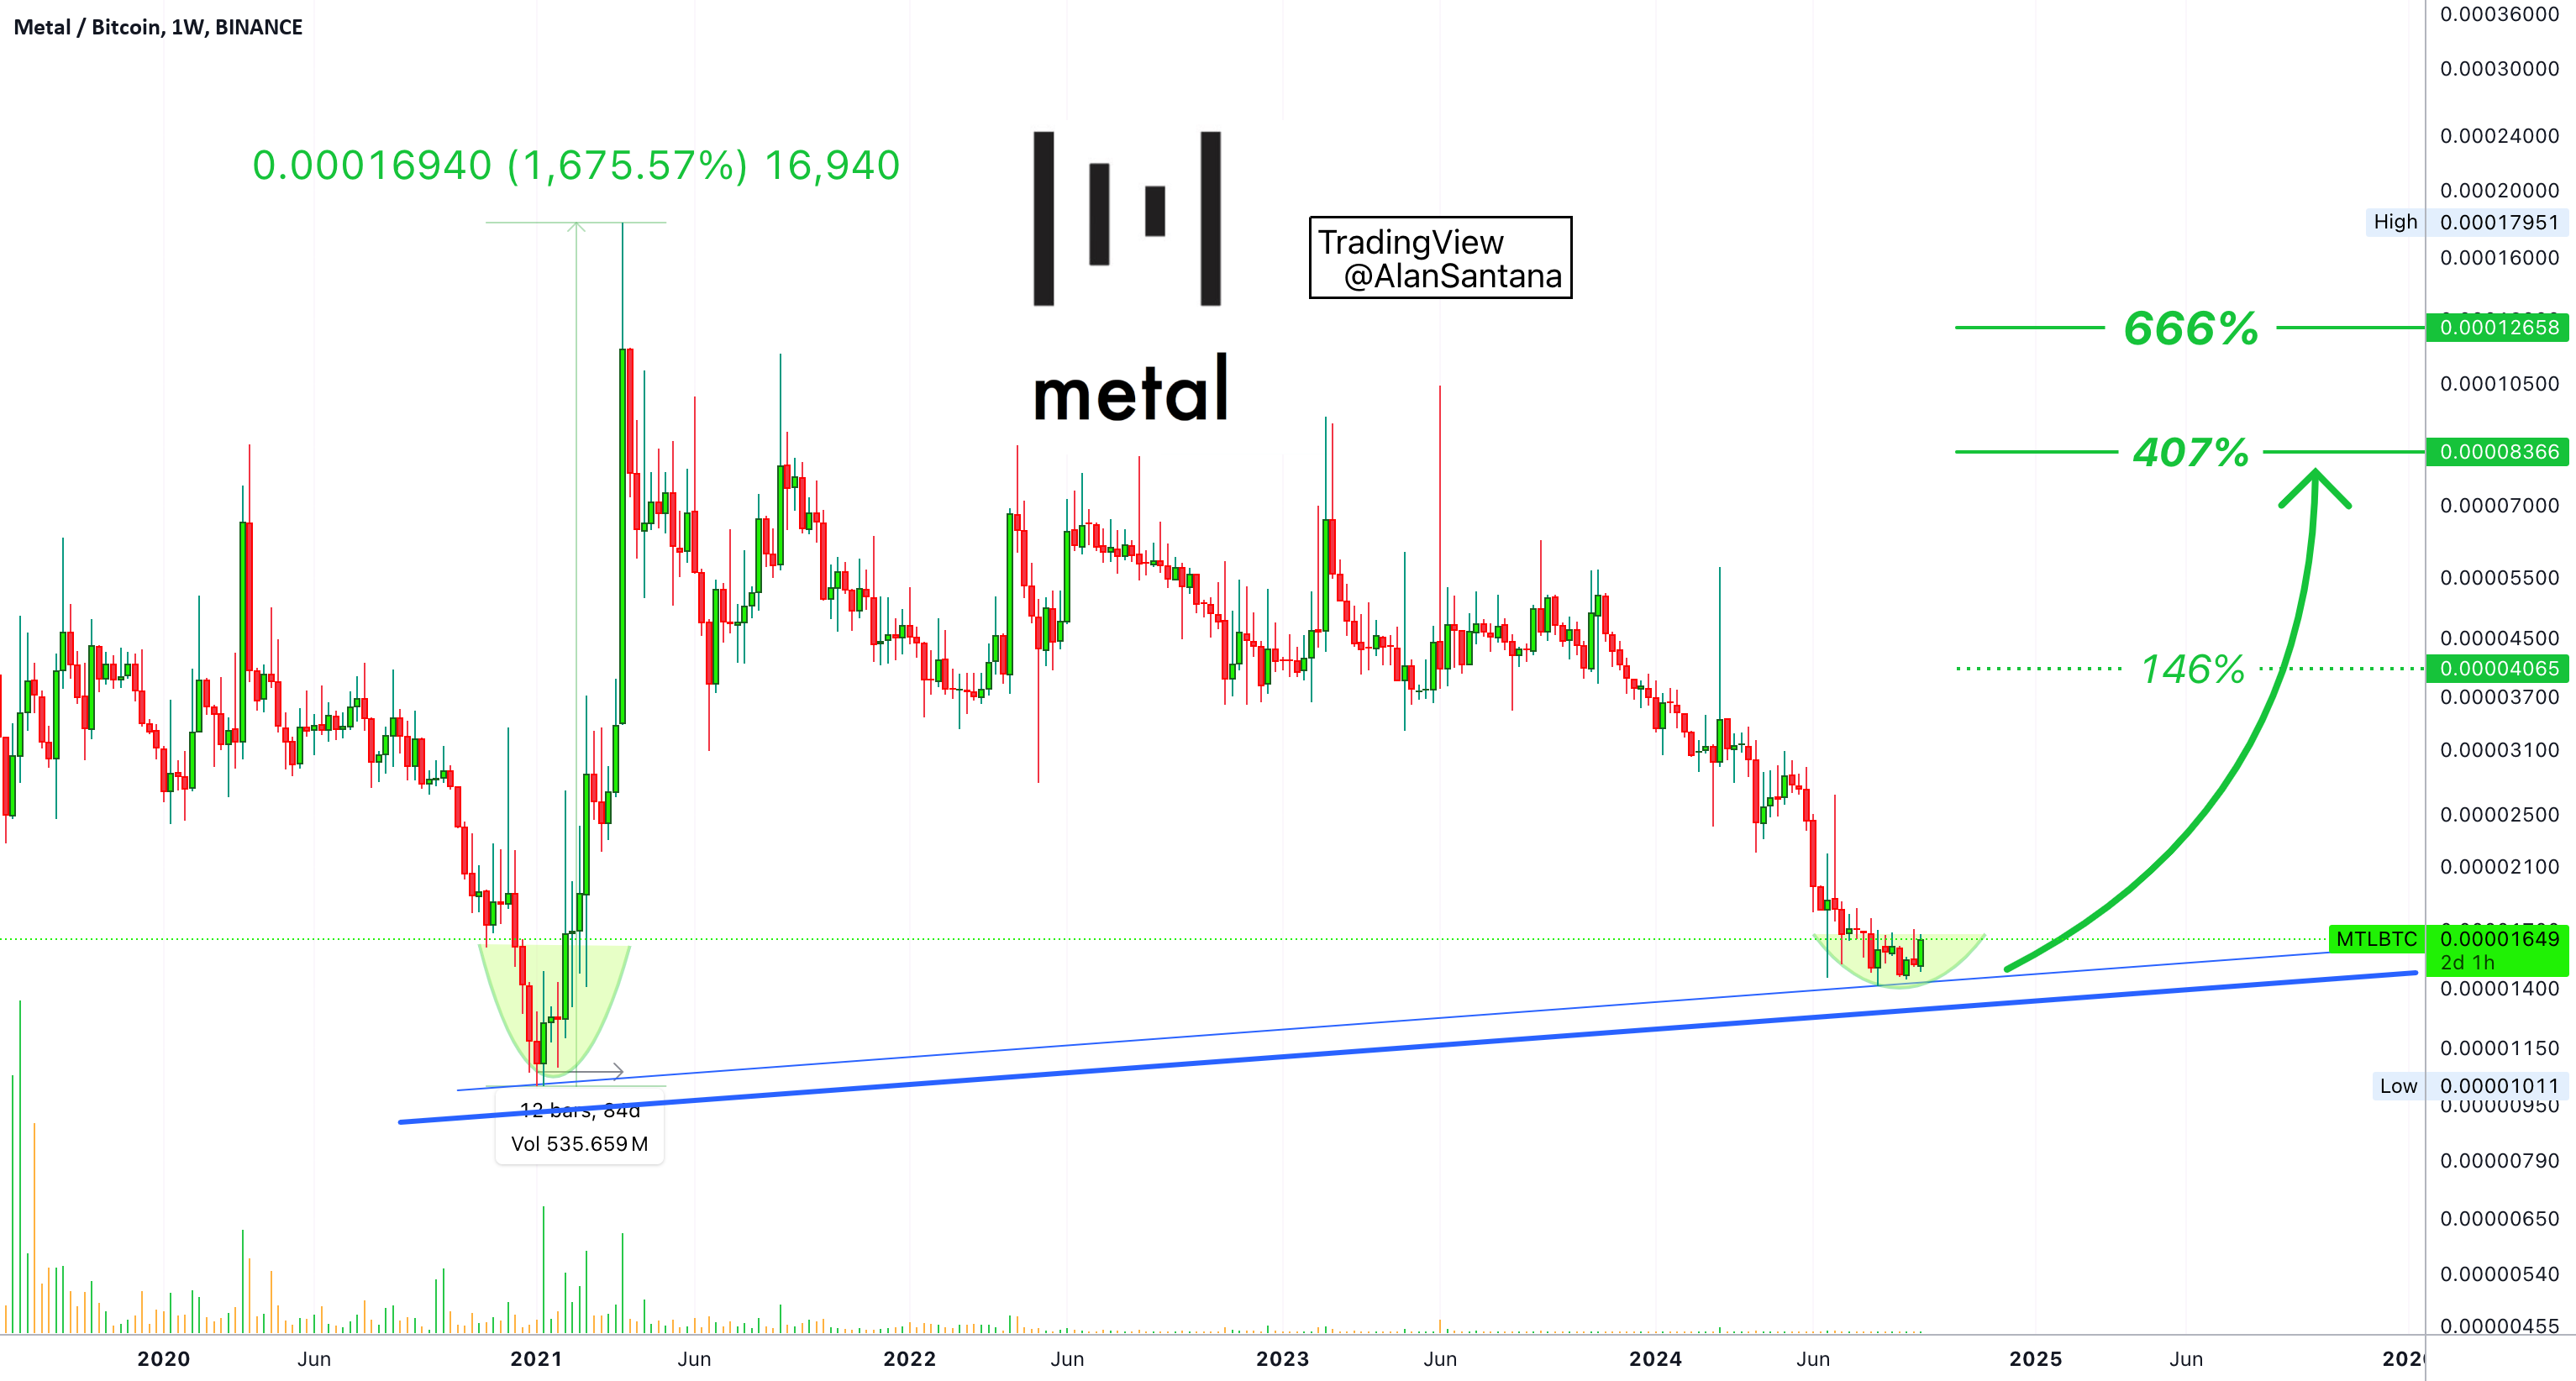
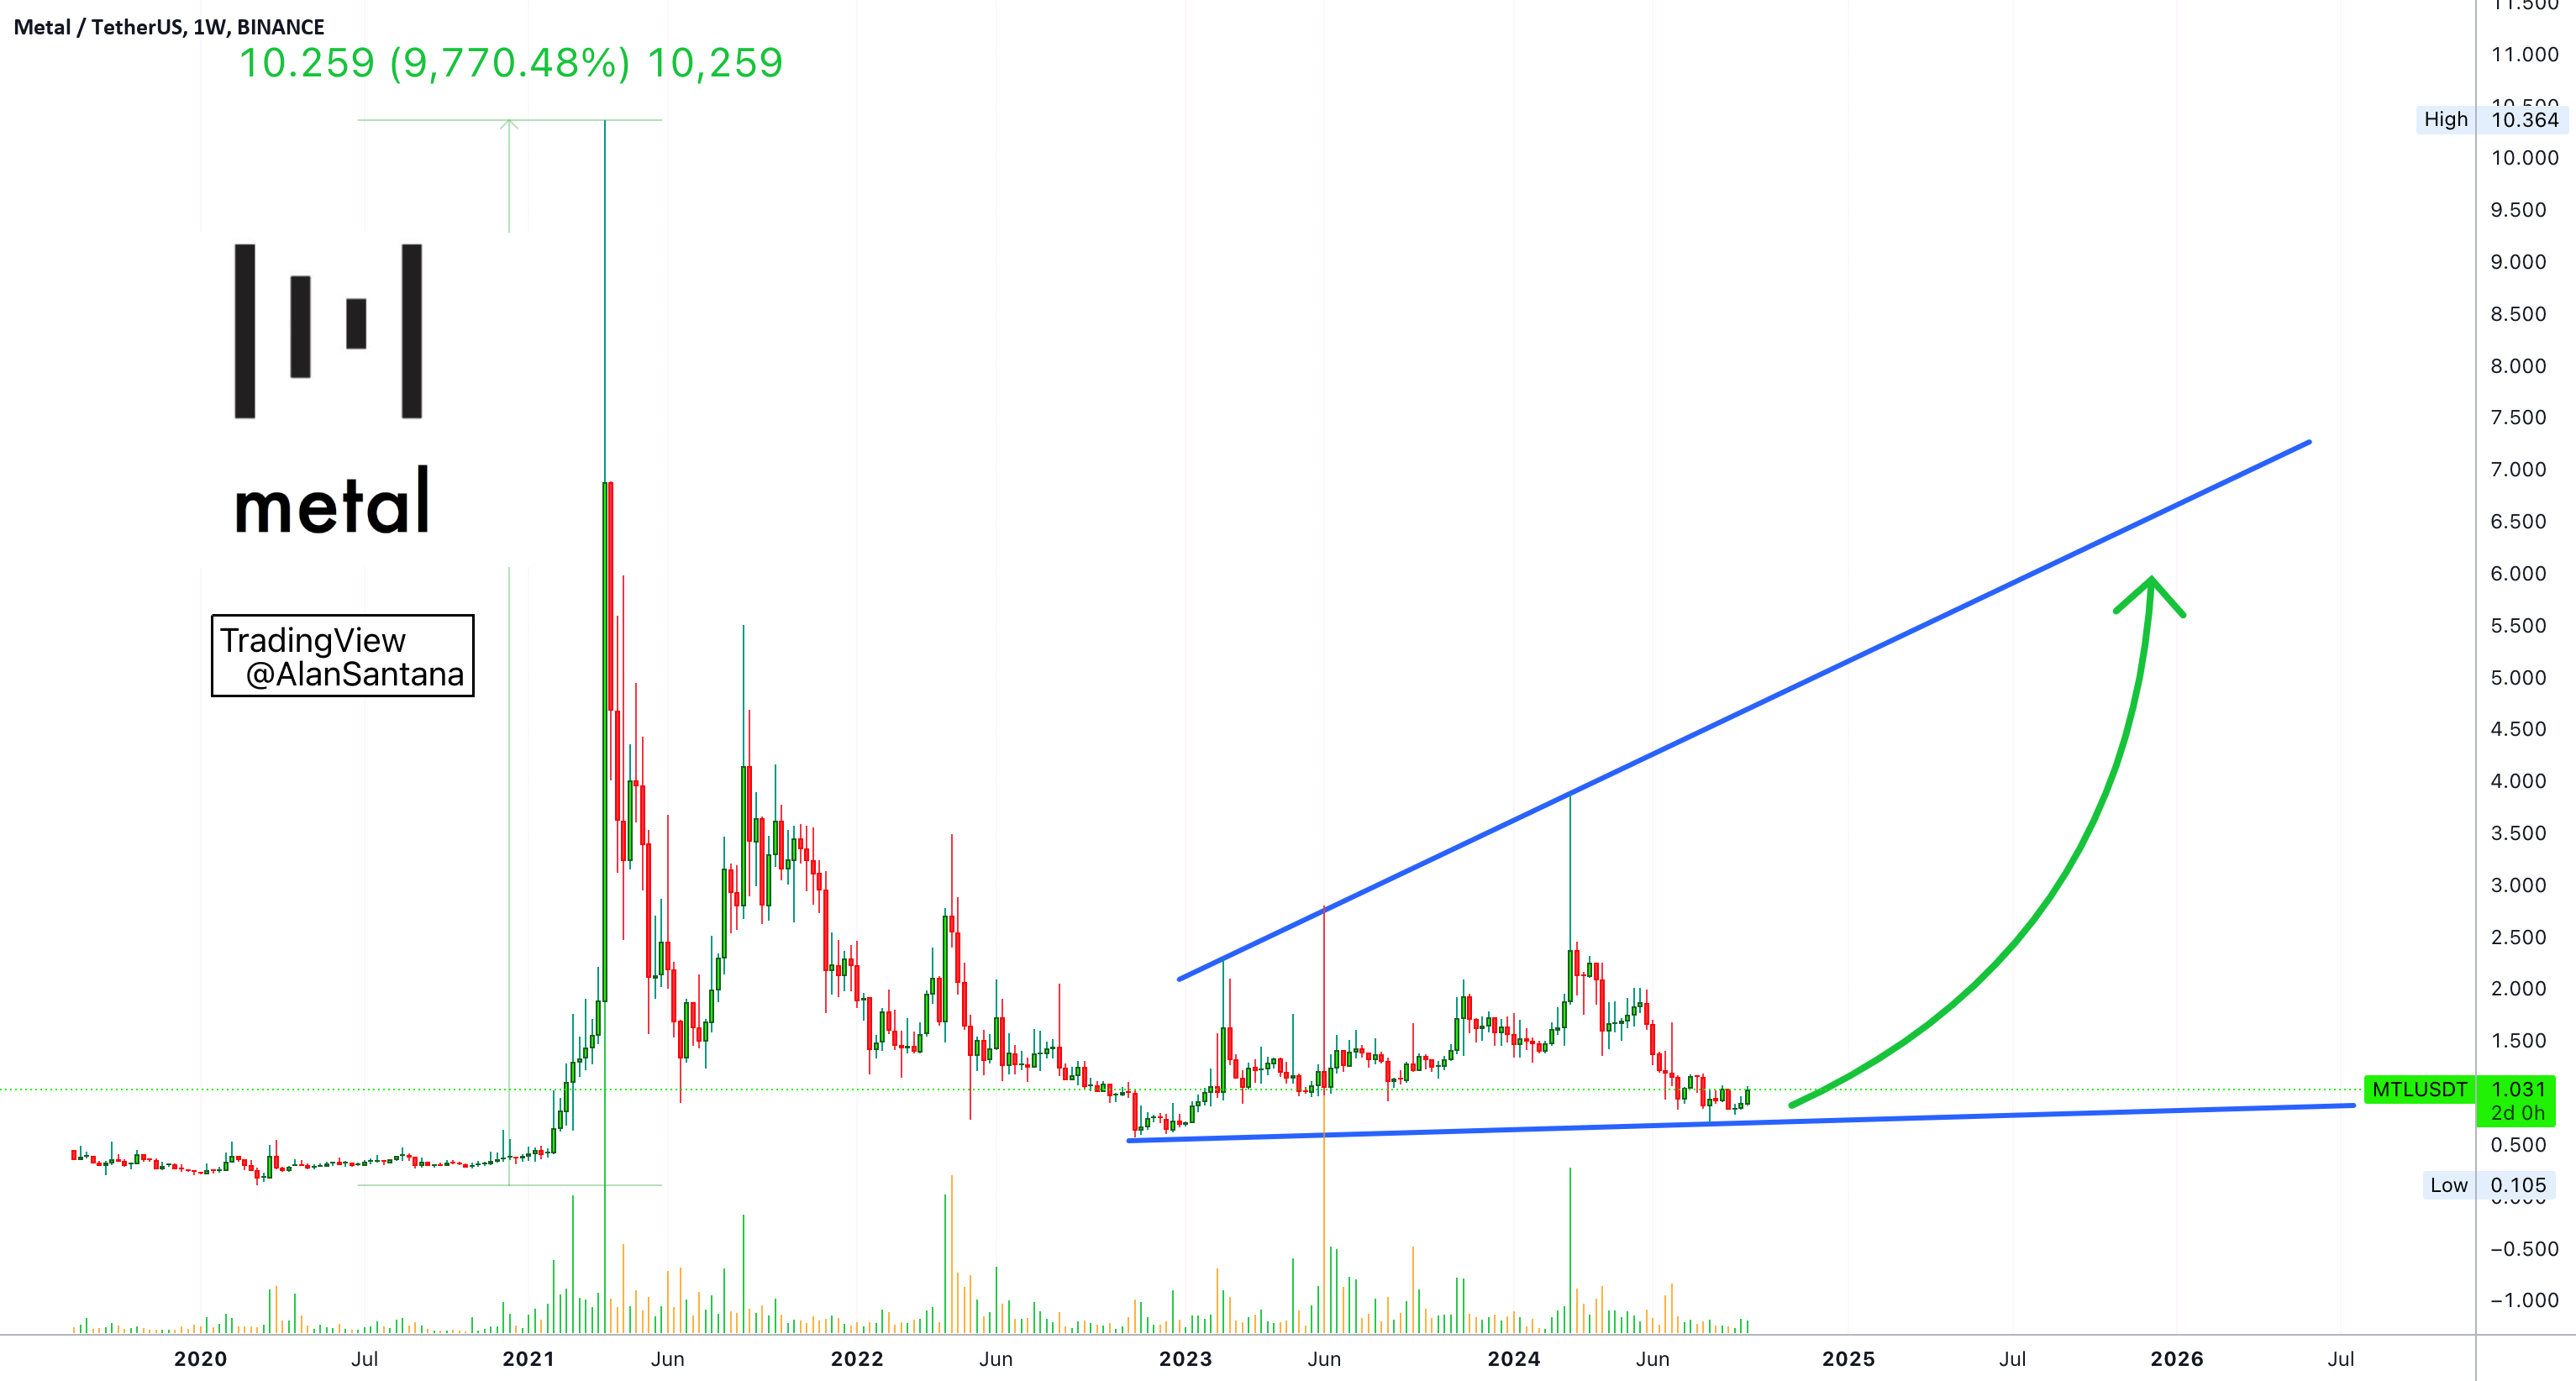
Compare this one to DODOBTC. Dodo's bullish wave lasted 49 days, this one lasted a nice 84 days and it was up, up, up, up, up... Non-stop.Metal hit a major
Consolidation since November 2022, that's almost two years old. The upper trendline (blue) of the widening channel has been challenged three times, perfectly. Metal (MTLUSDT) just tested the lower trendline
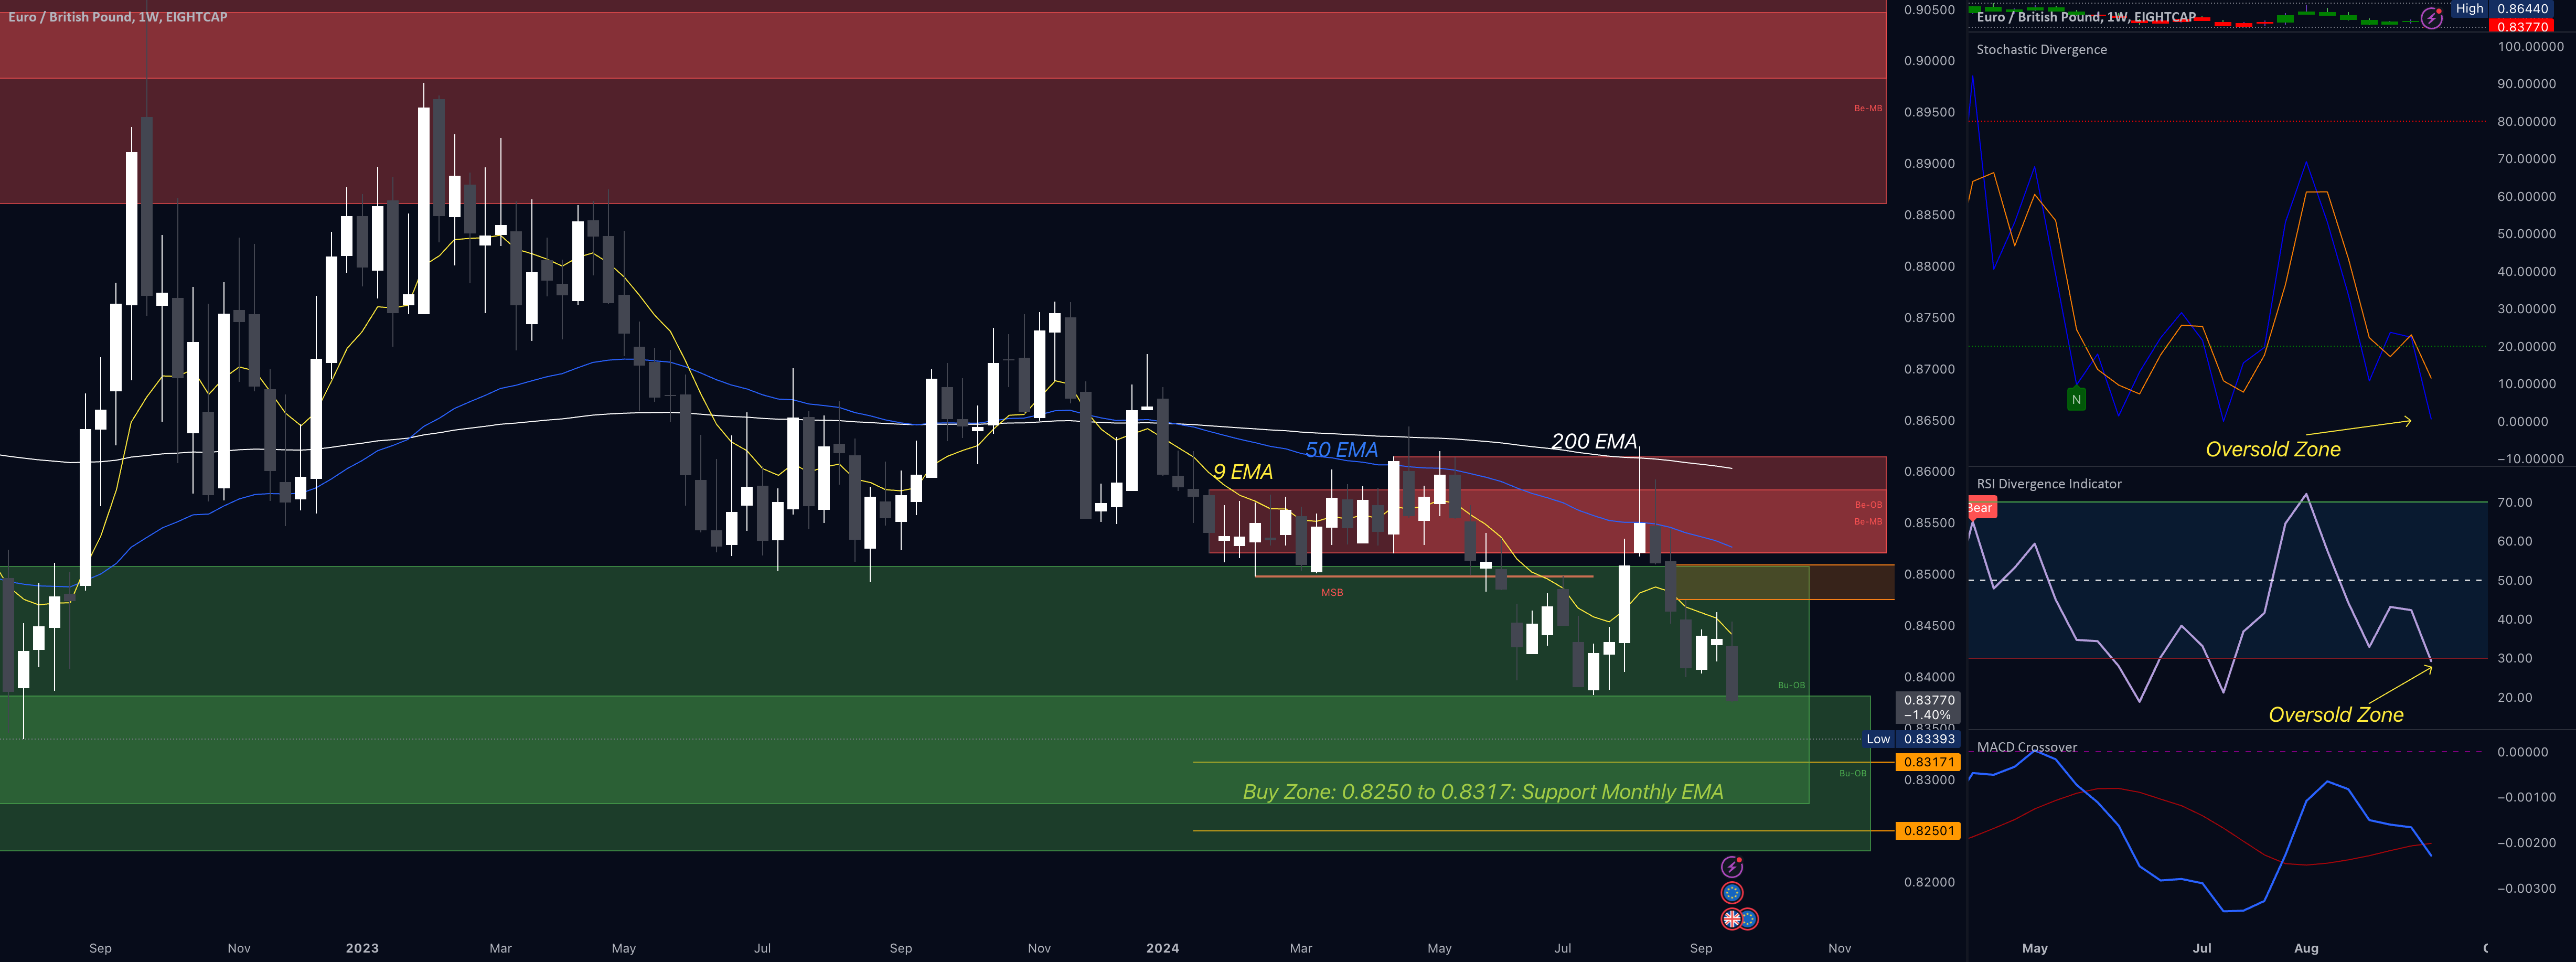
https://www.tradingview.com/x/ELhEe9DK/An easy trend following Short of EURGBP, forget the complexities of for-example trading Gold, this one was 'in the bag' as a Short all week. Just pull up a 4
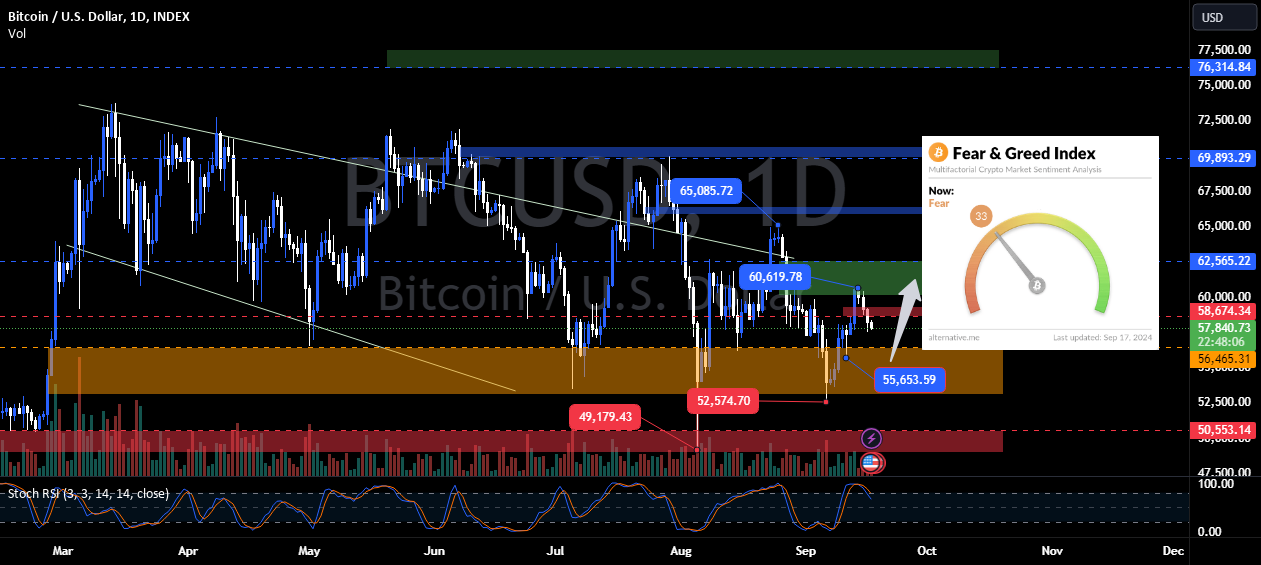
GM crypto bro's, this morning BTC dropped back to the 57K range as I mentioned in yesterday's market update. The Fear and Greed Index also dipped further into the fear
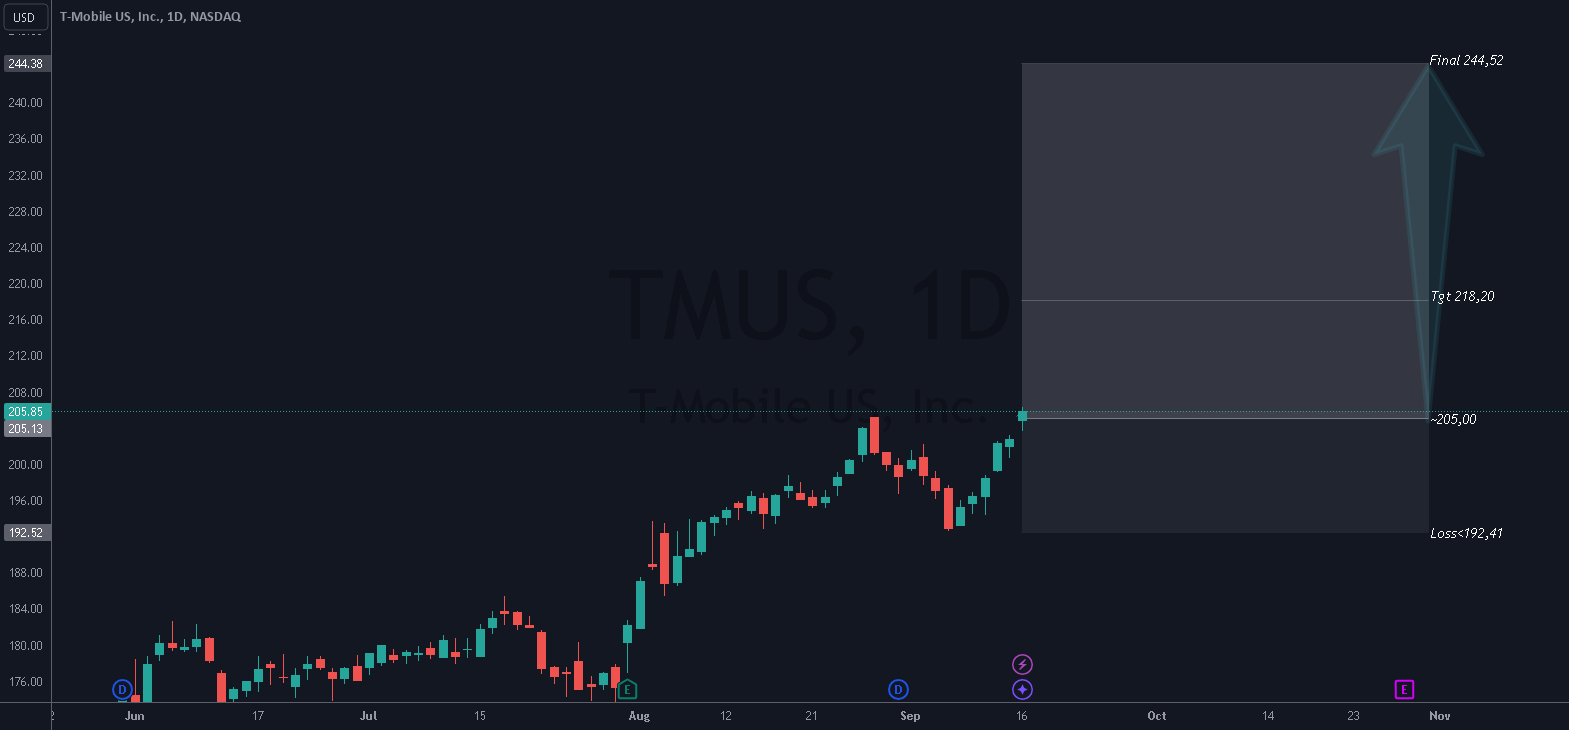
The alignment and compression of FIboClouds signal a continuation of the uptrend. Risk-Reward Ratio: 3.If this projection is confirmed and a partial profit is taken at the first target, the
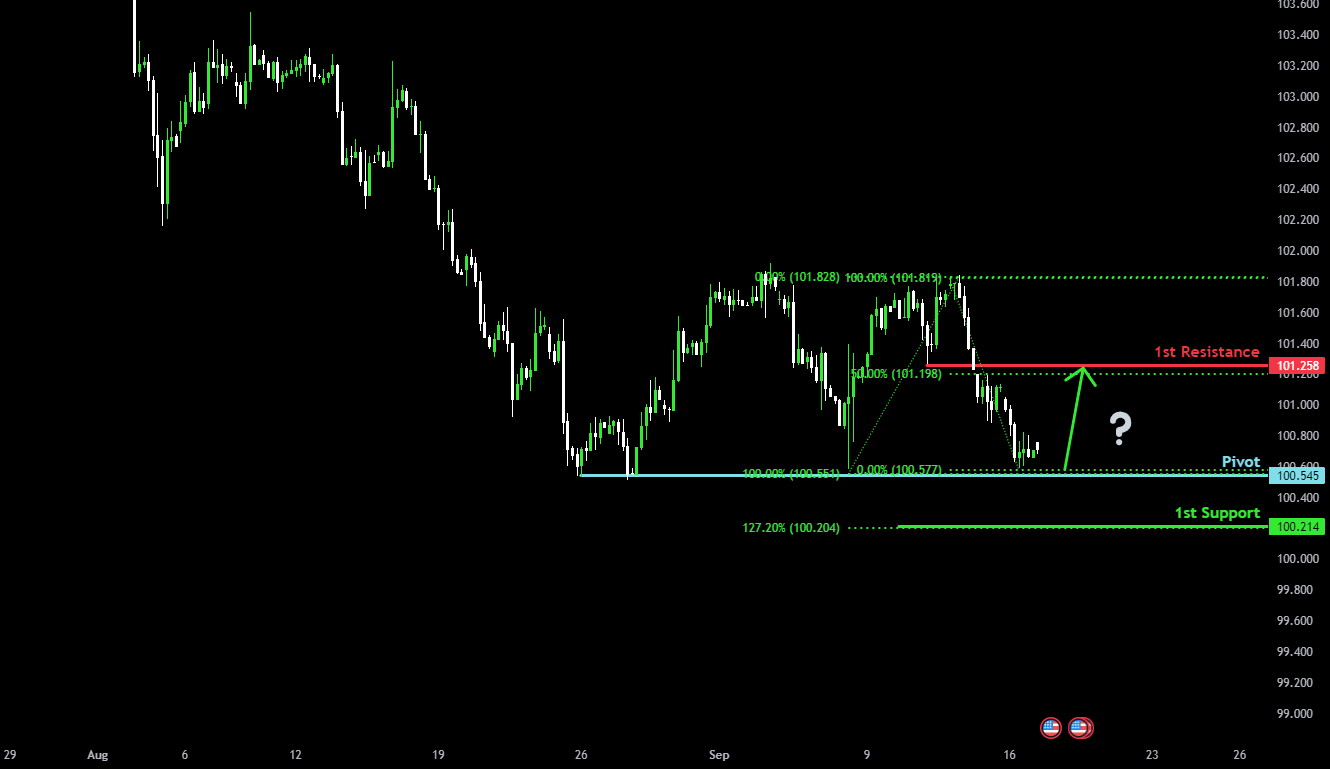
US Dollar Index (DXY) is falling towards the pivot which has been identified as a pullback support and could bounce to the 1st resistance that acts as a pullback resistance.Pivot: