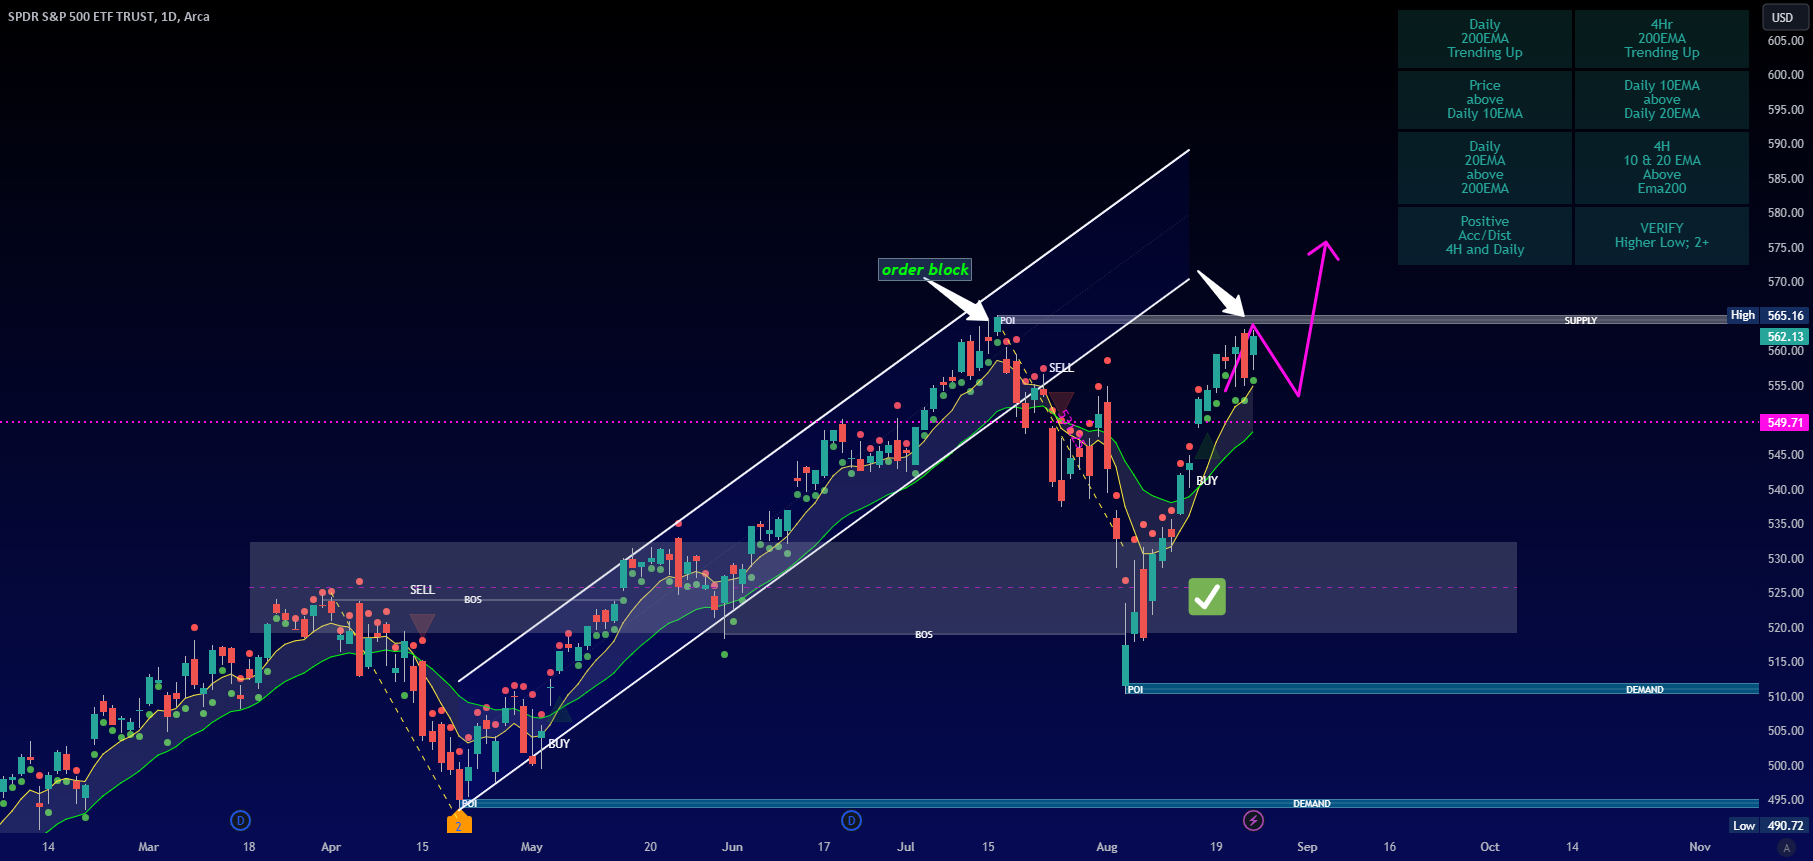
Weekly Analysis: PA is in bullish posture Daily Analysis: Bullish posture. Price action is currently at an all time high4HR Analysis: PA can either break through highs and continue upwards
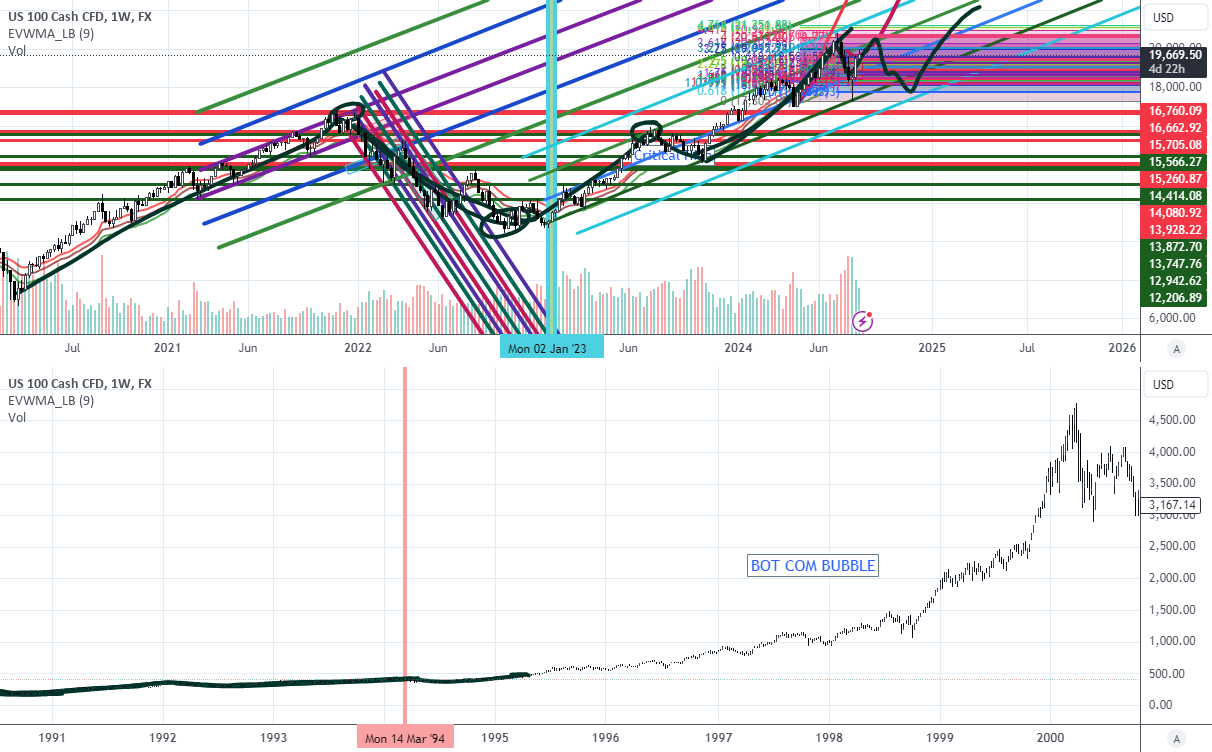
I spent quite a bit of time this weekend going over my custom indexes and other research data to try to identify what and how the Vortex Rally I predicted
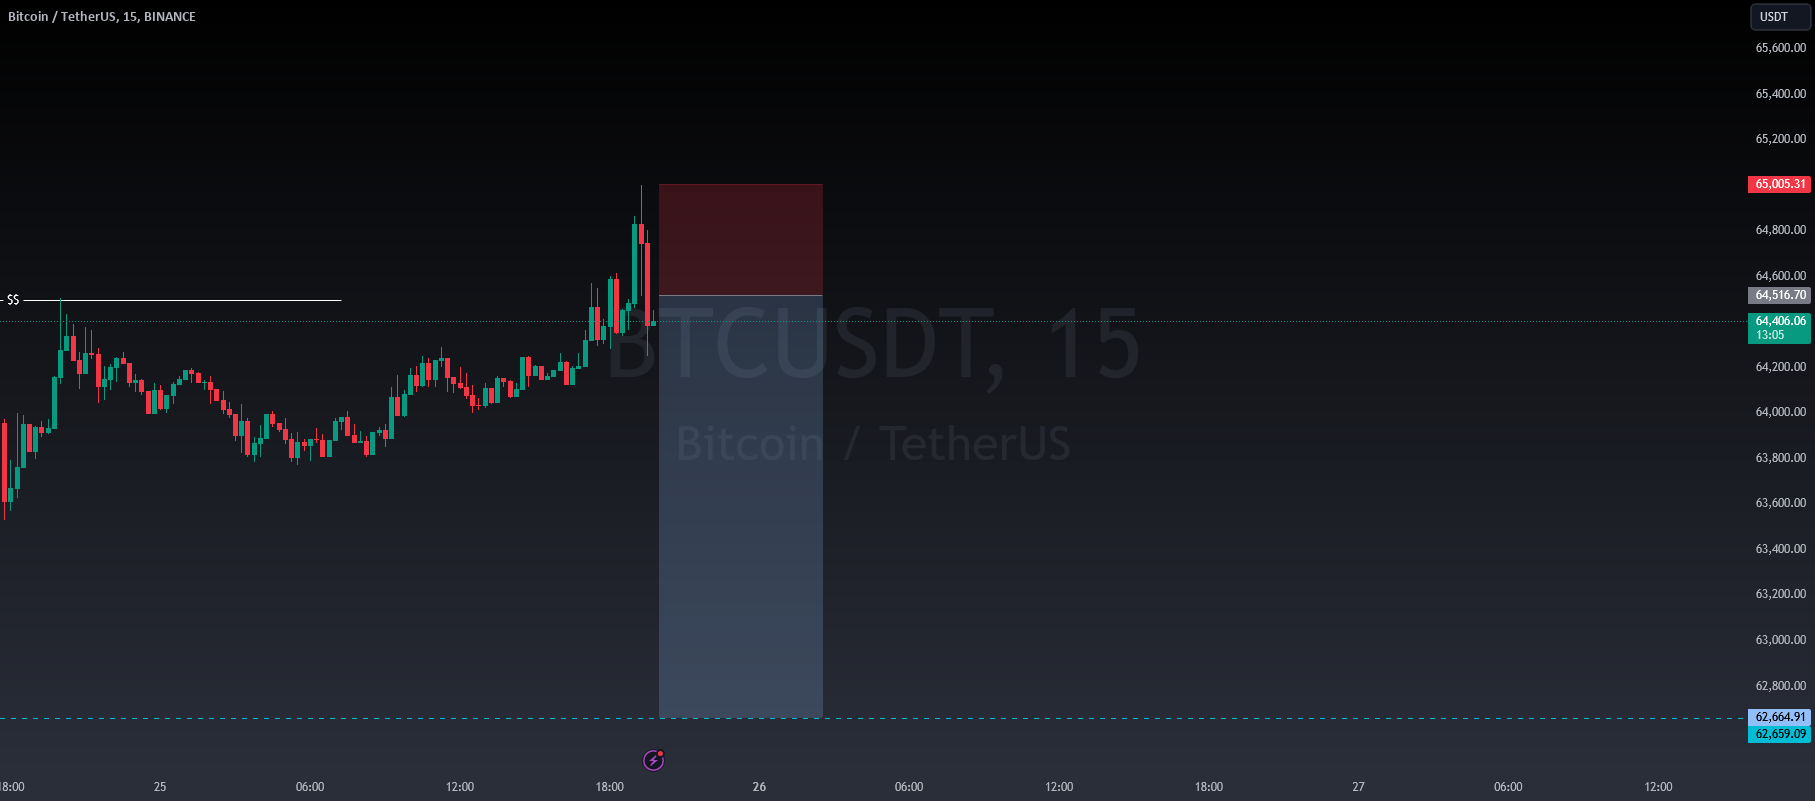
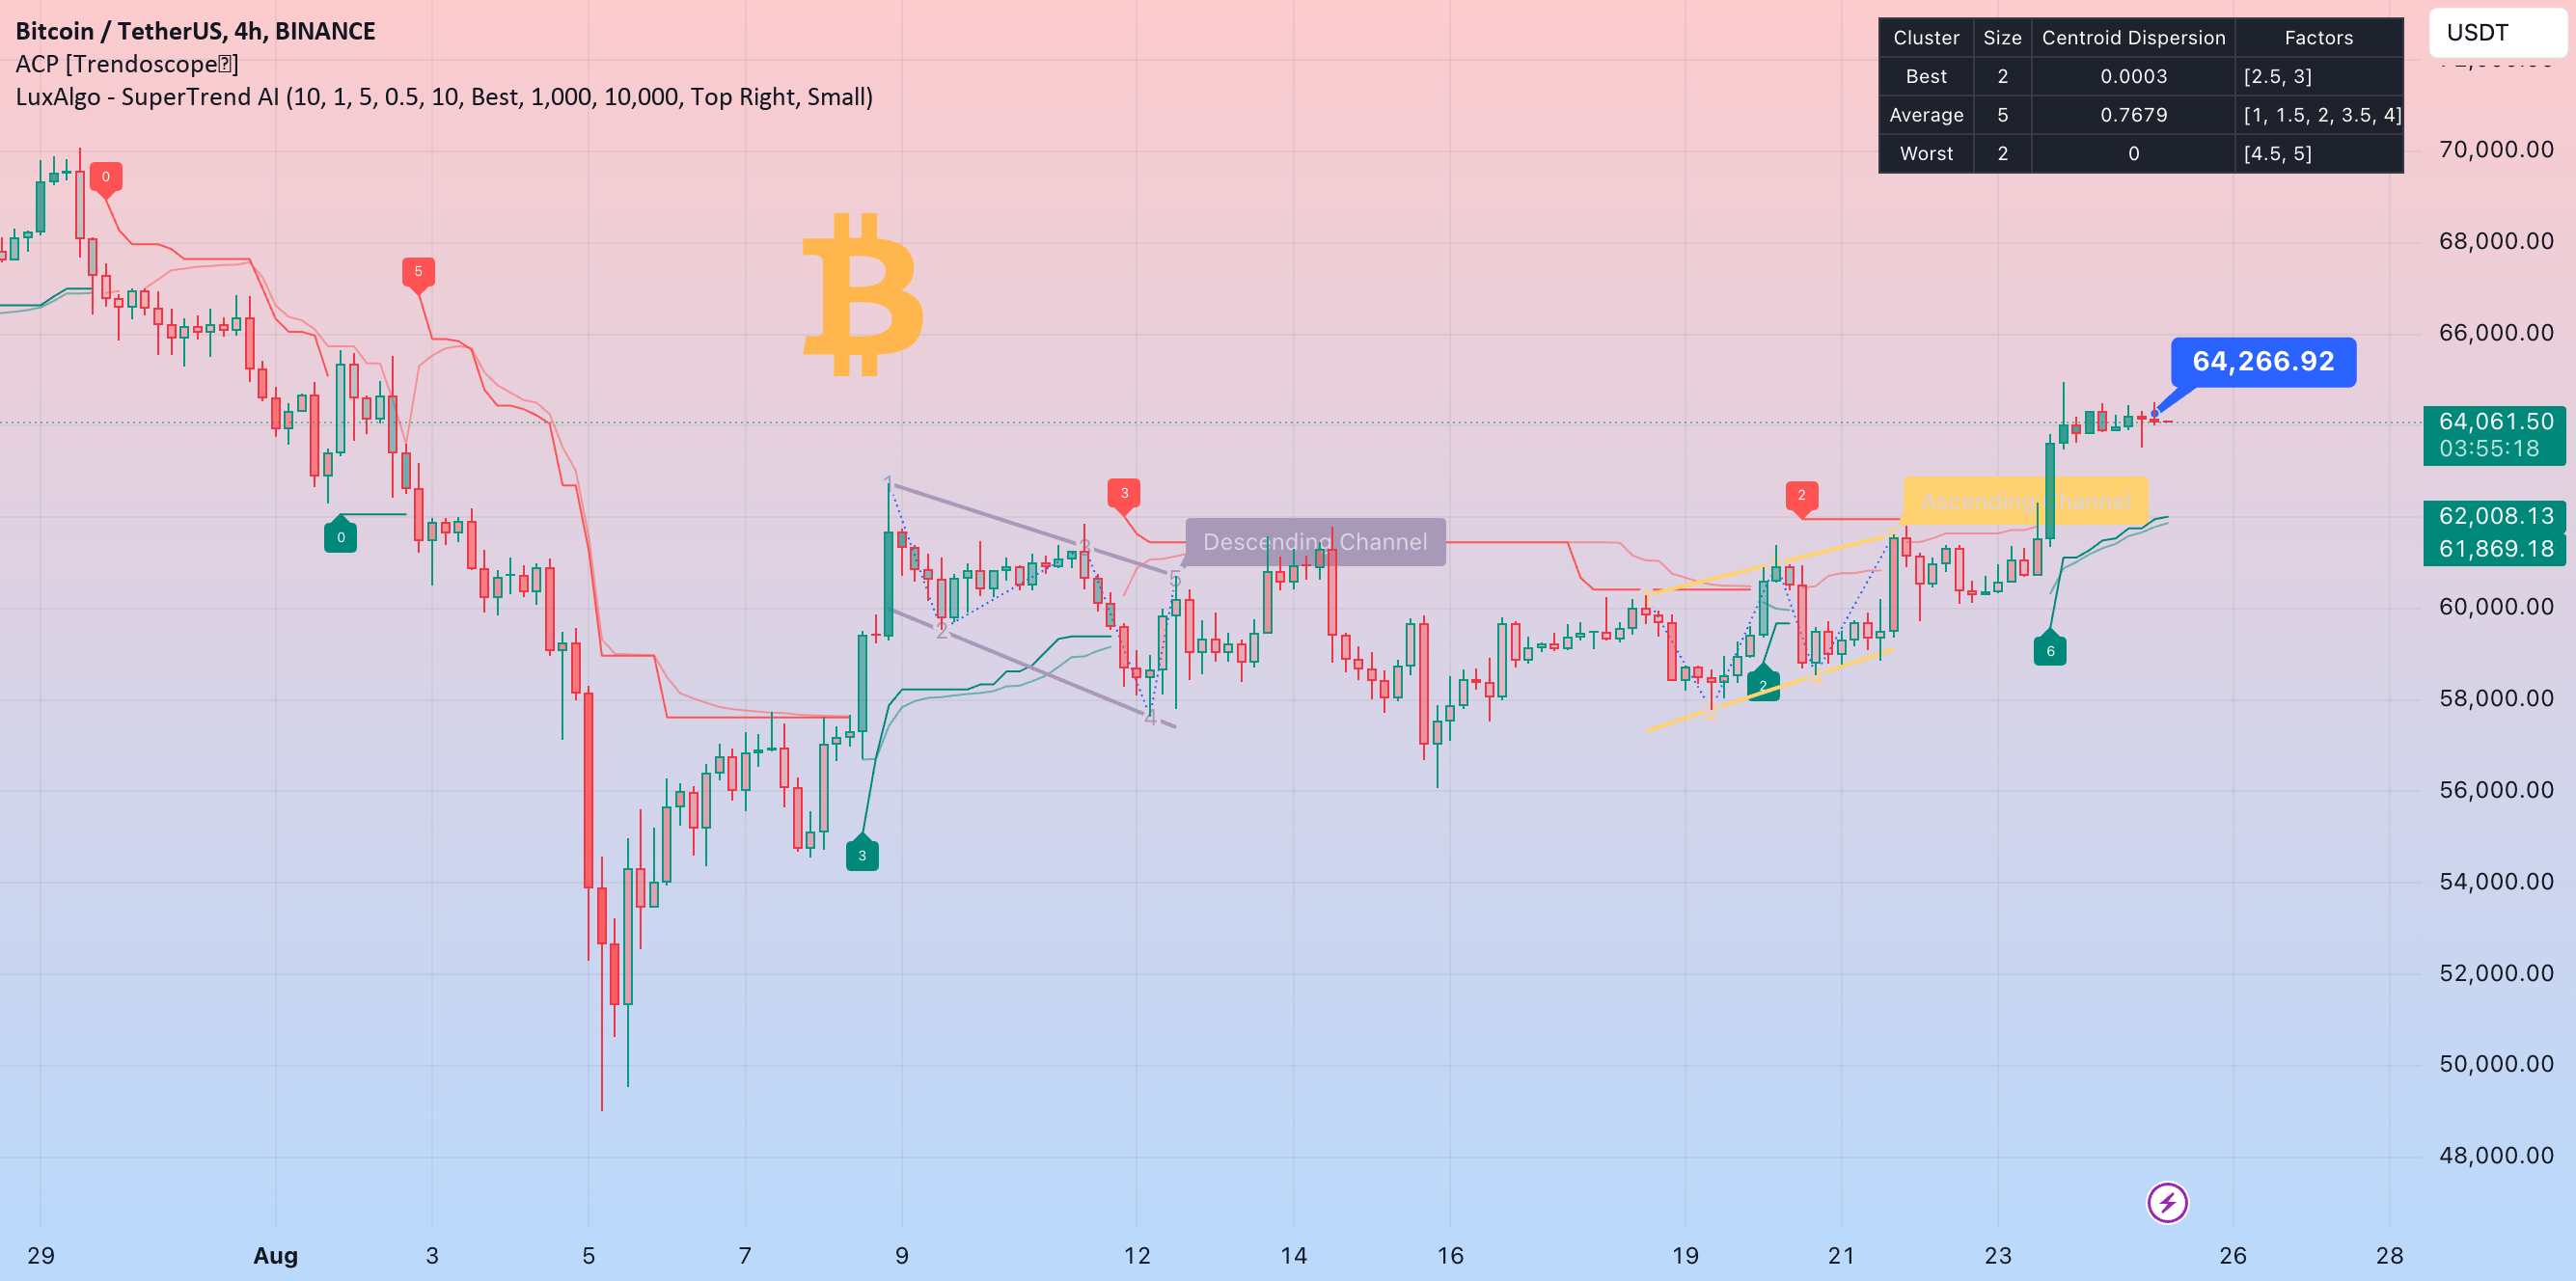
3 hours agoBitcoin (BTC) is currently reacting within an institutional zone, which is a key price area where large investors, known as "whales," typically make significant trades. In this case,
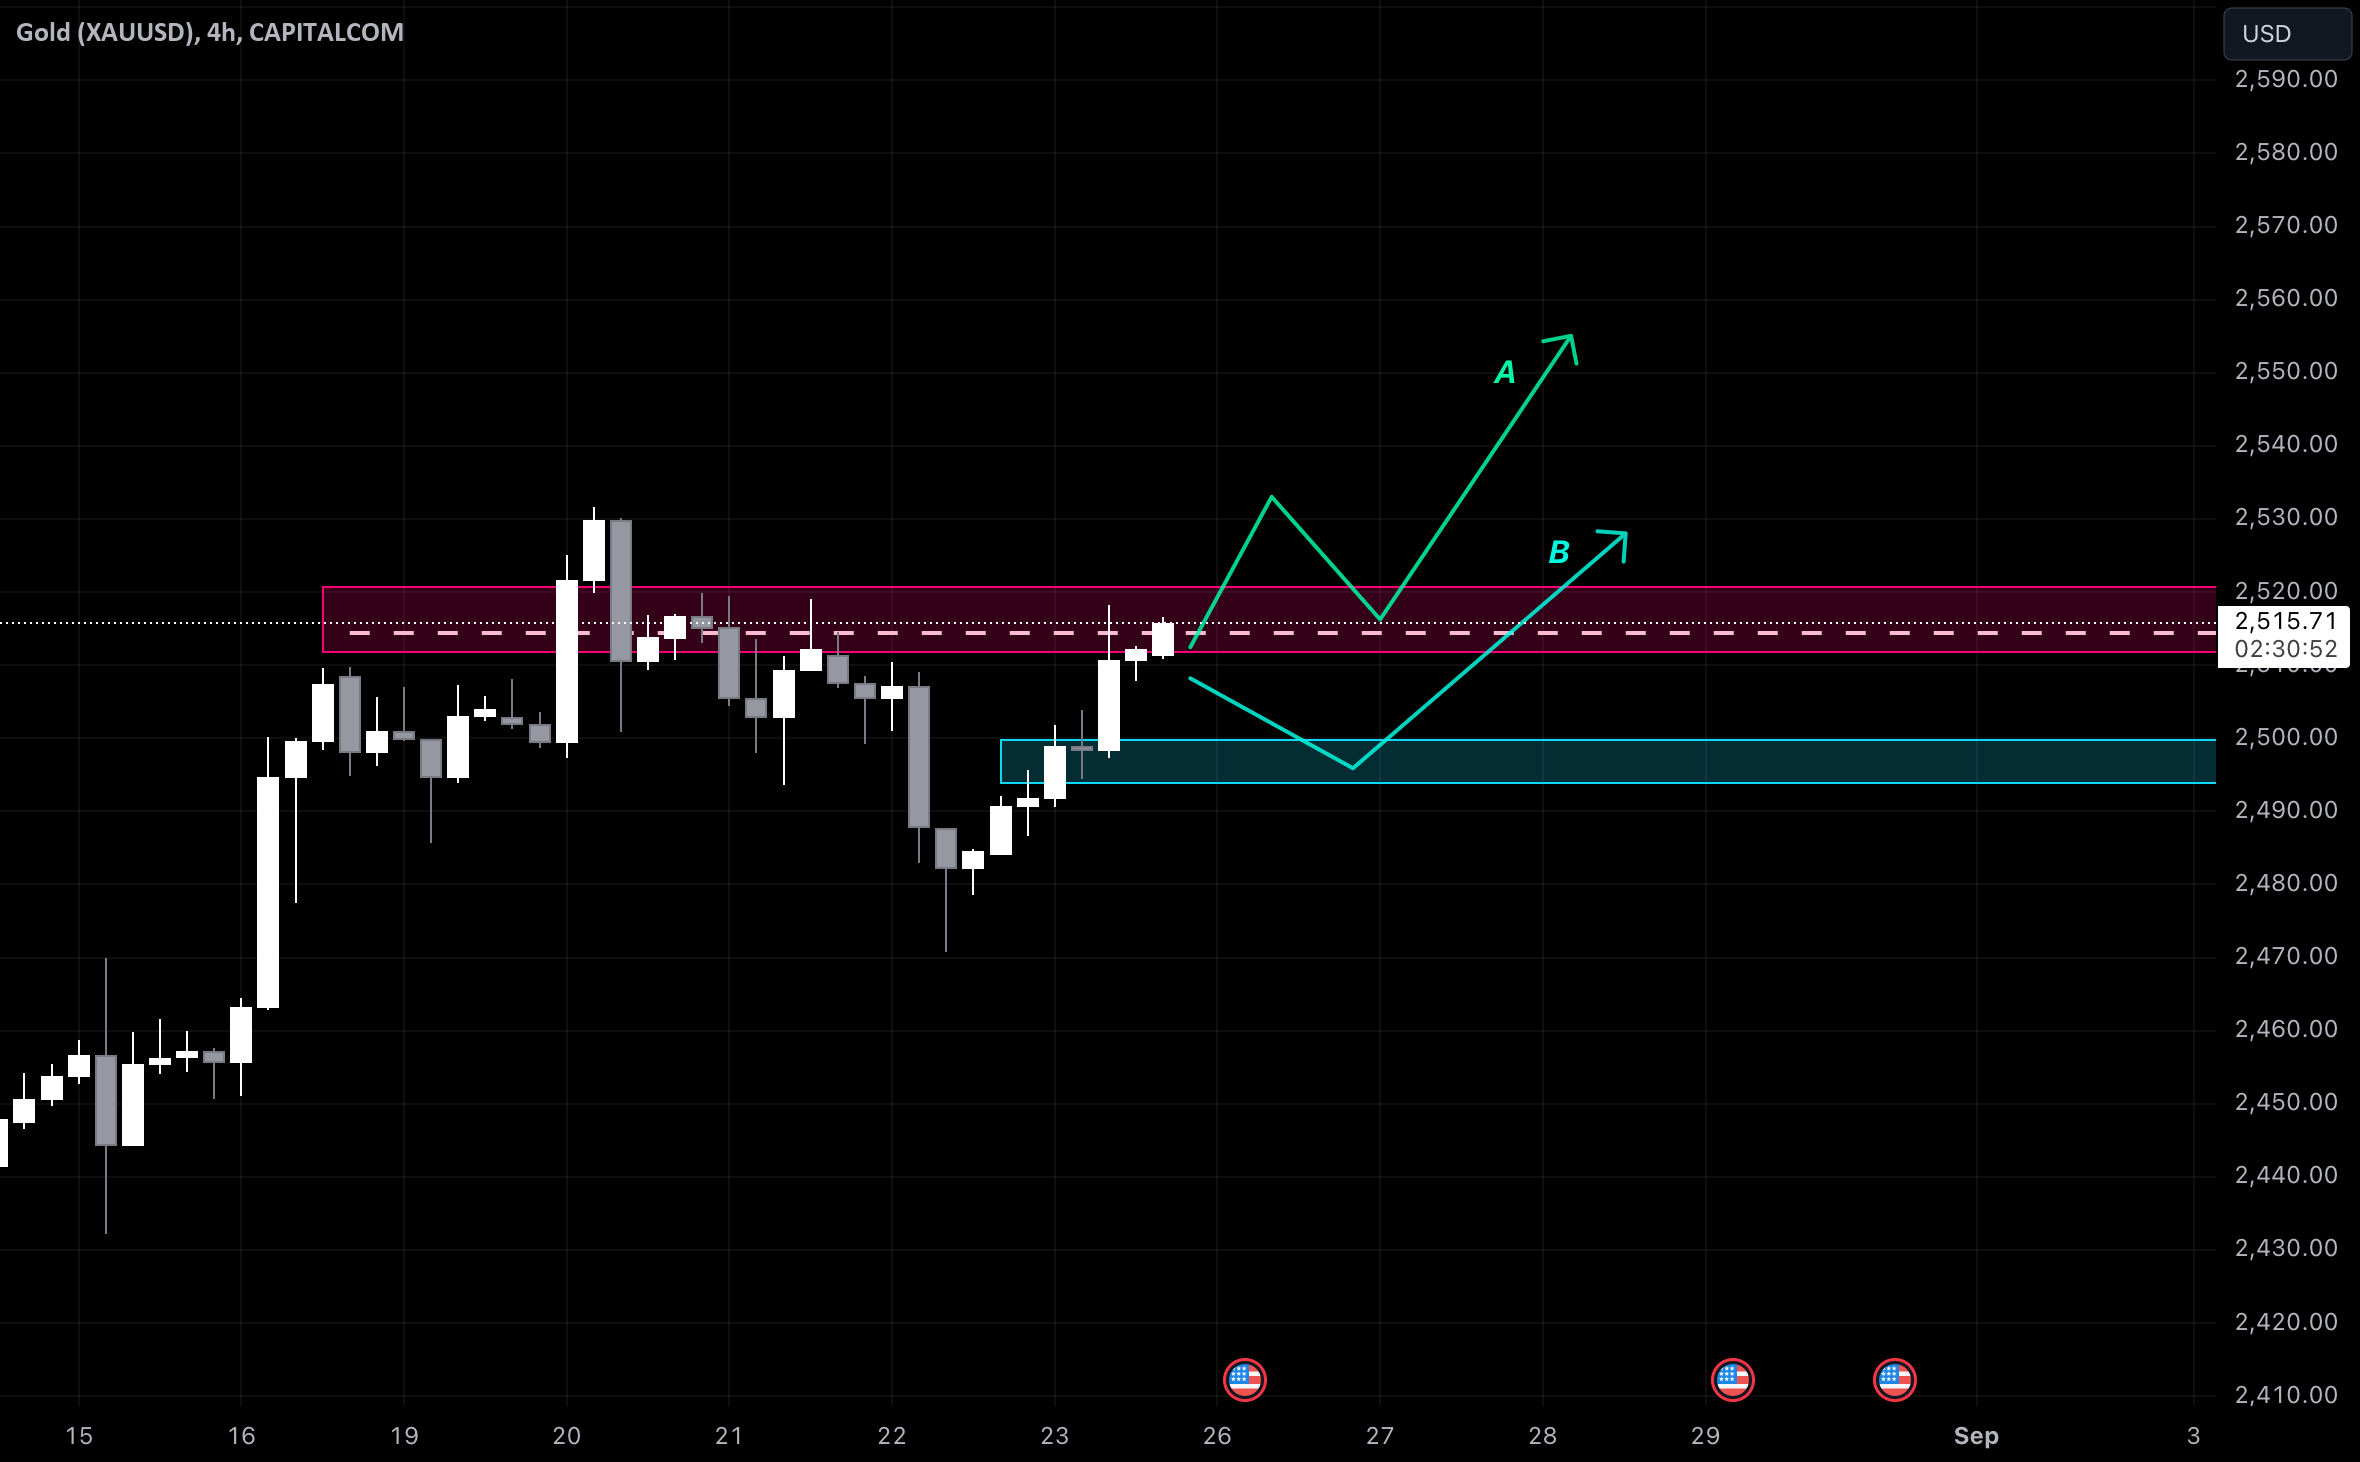
We are very close to the price reaching our institutional order block in the supply zone, where we could expect a small liquidity rejection upon touching it.According to my forecast,
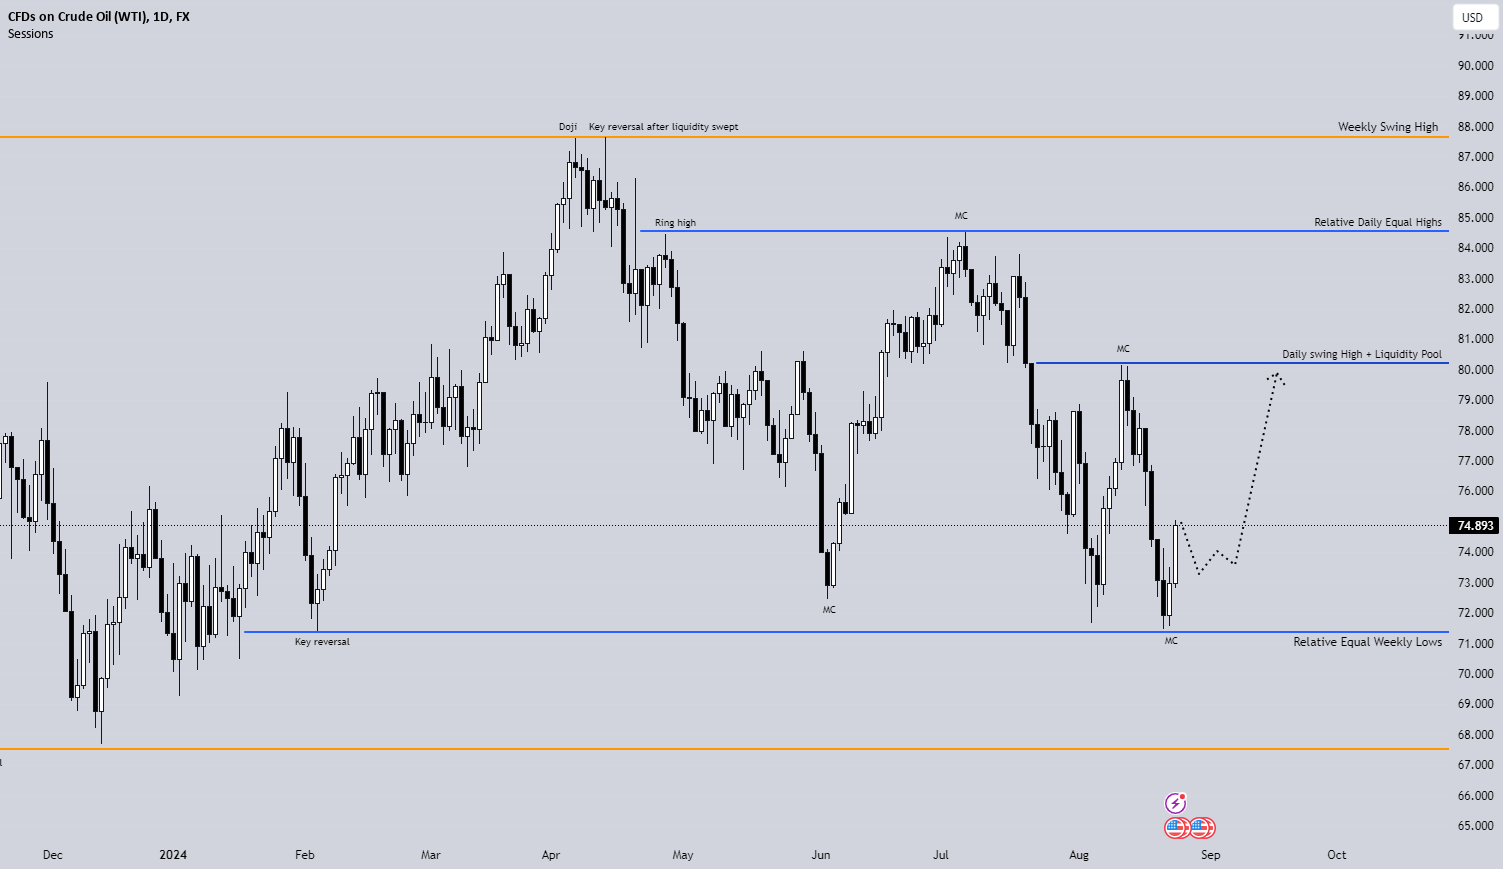
**Monthly chart**Last month's candle was bearish after sweeping liquidity from 84.5 level and then pushed lower for around 1,000 pips. This month's candle (August) which is still active, continued its
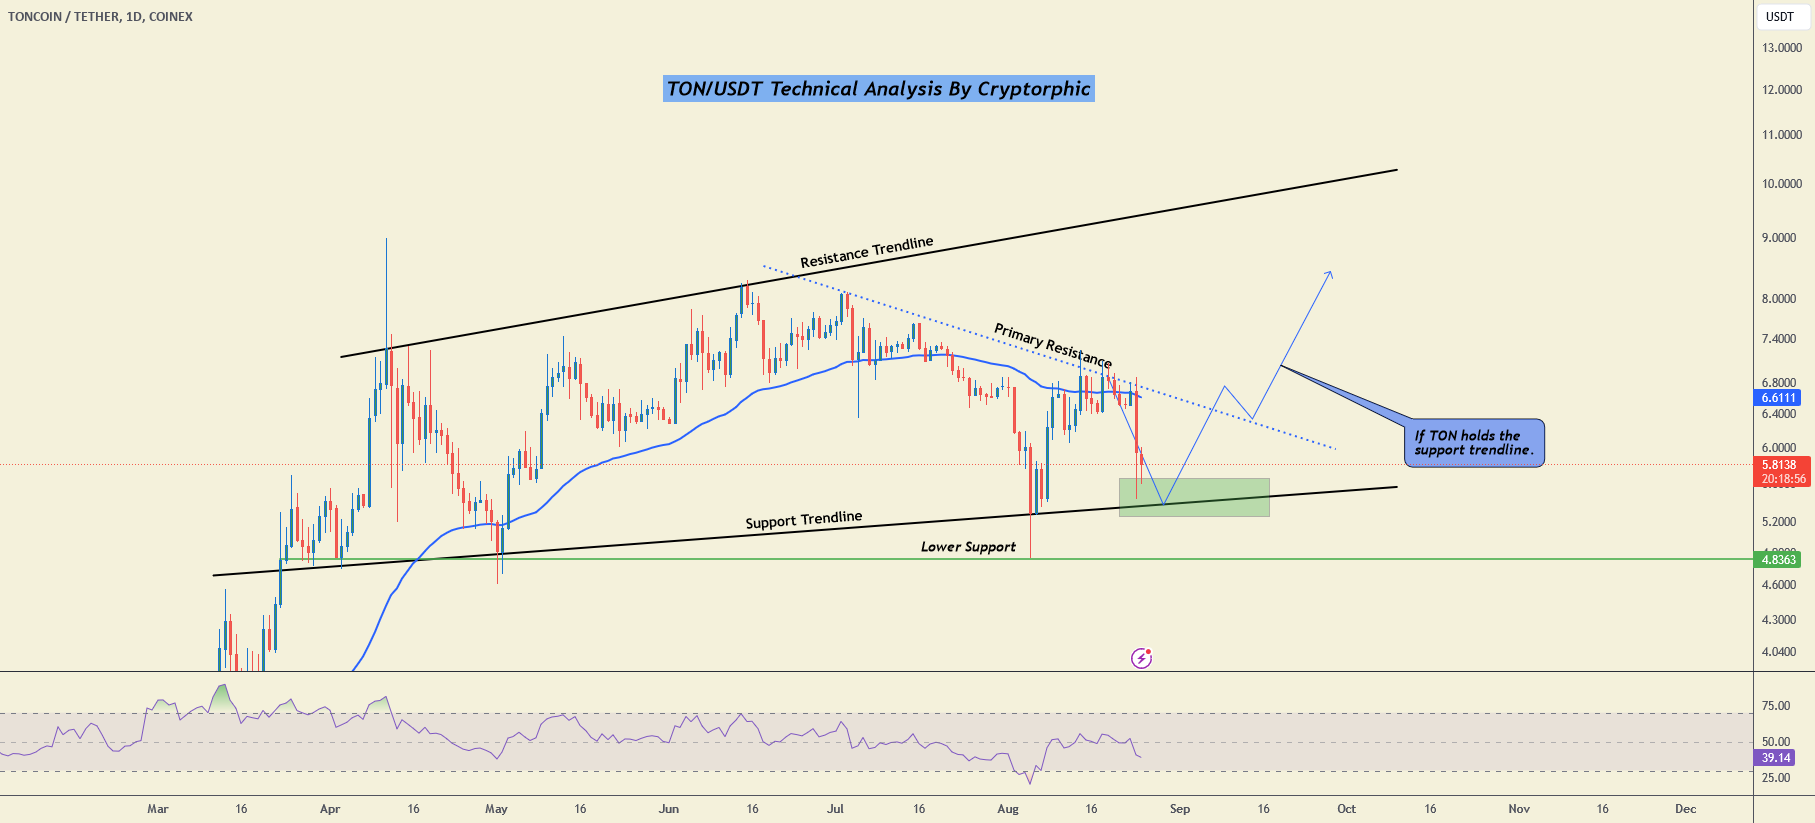
Hello everyone, I’m Cryptorphic. I’ve been sharing insightful charts and analysis for the past seven years.Follow me for:~ Unbiased analyses on trending altcoins.~ Identifying altcoins with 10x-50x potential.~ Futures trade
Hello, guys.On the hourly chart, the rate of BTC is in the middle of the narrow channel between the support of $63,676 and the resistance of $64,460. If the rise
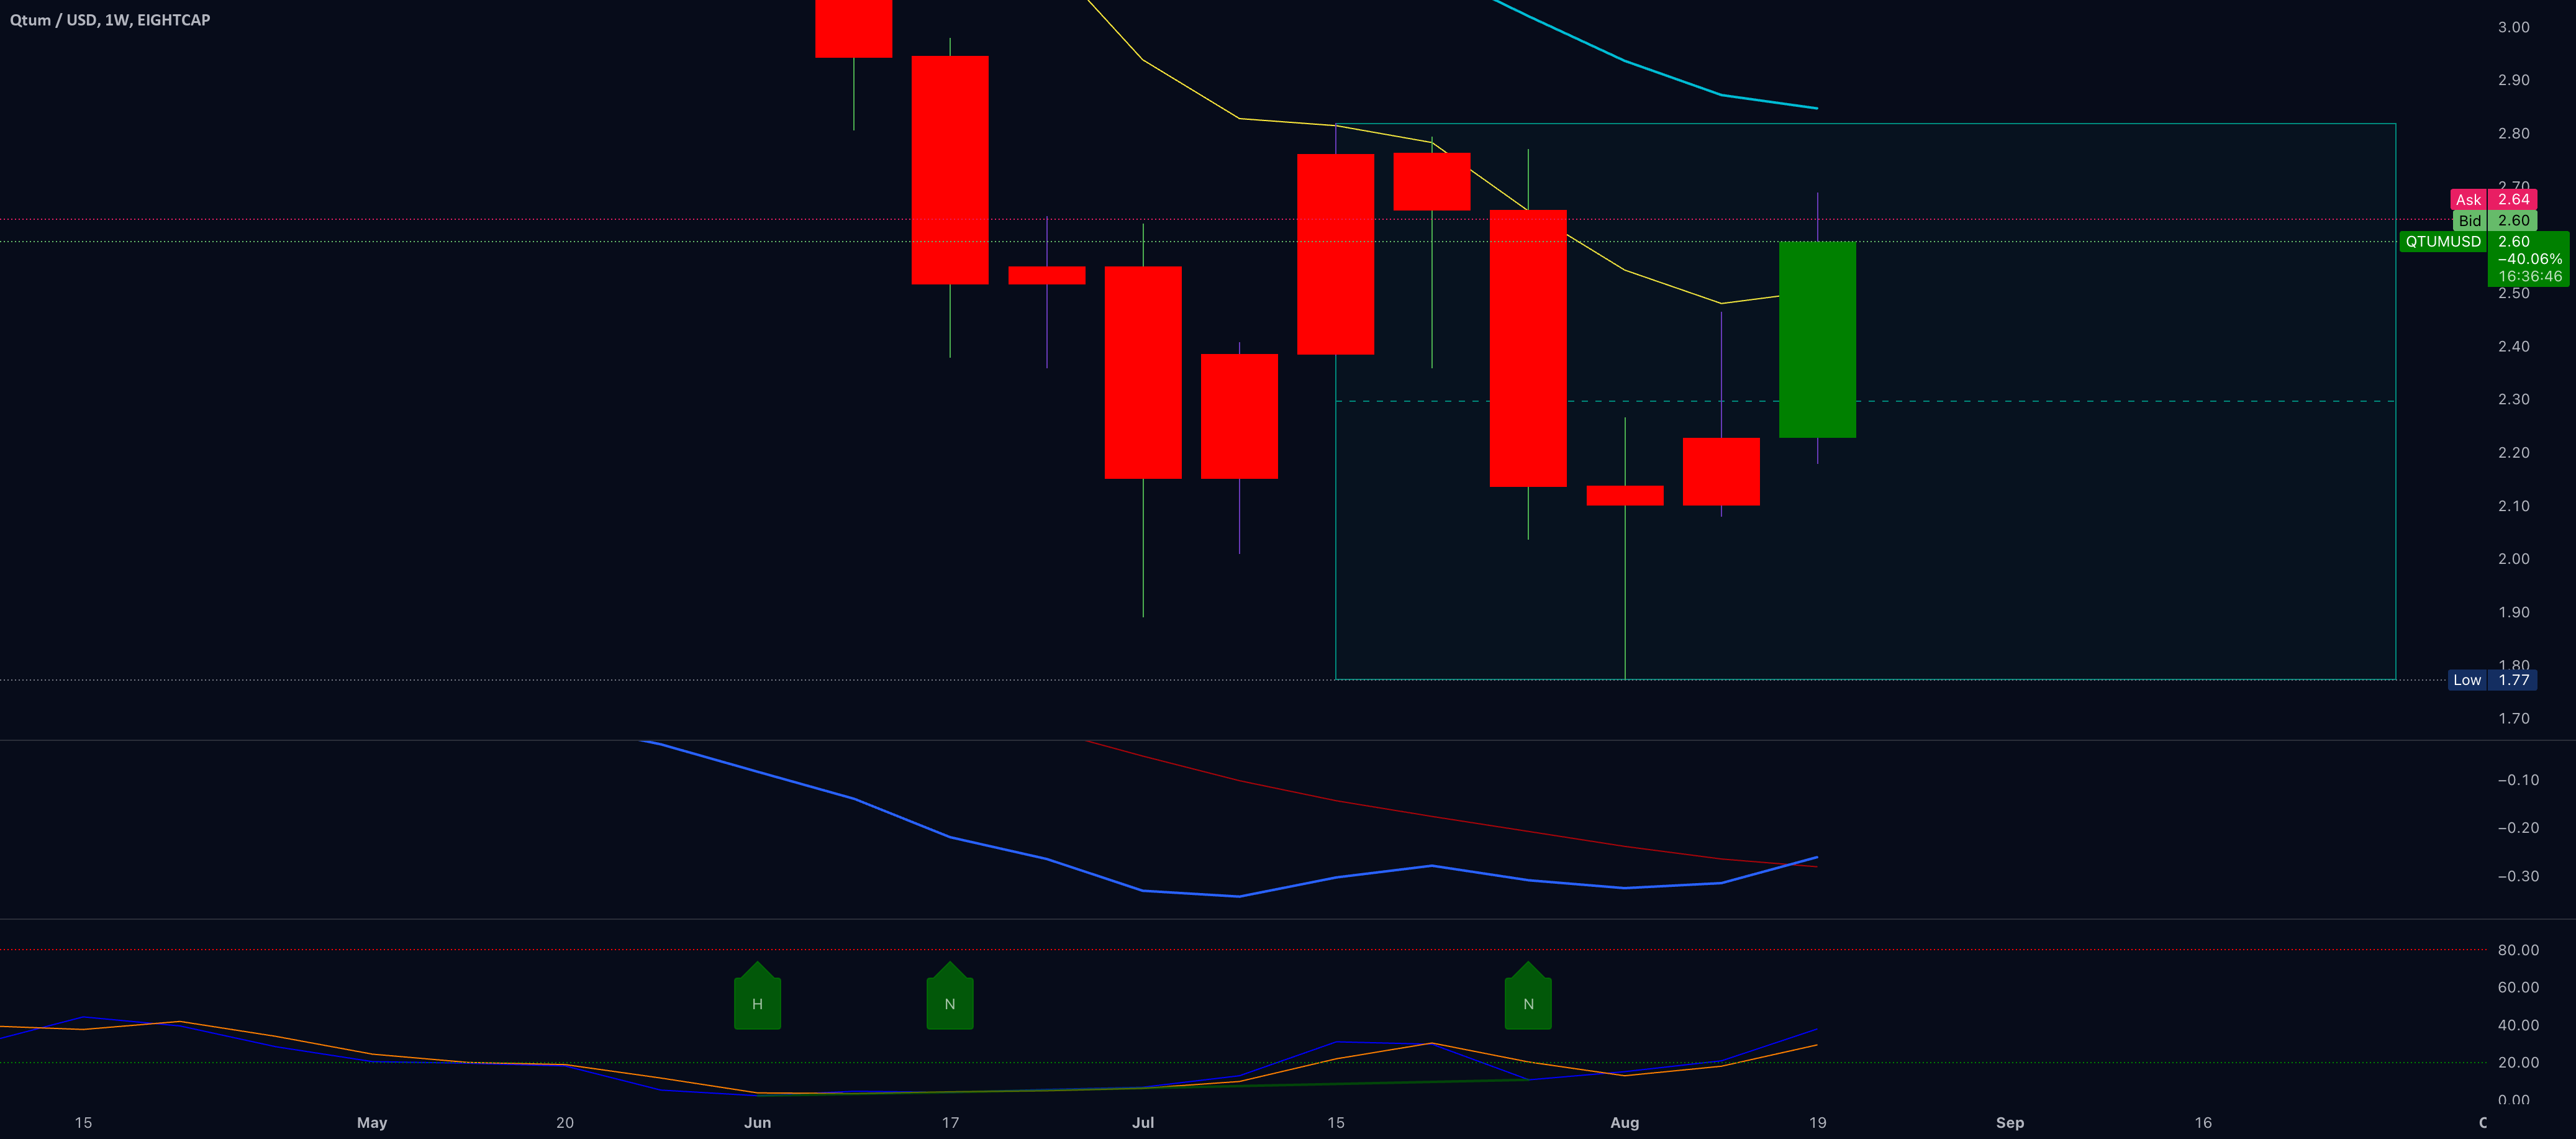
https://www.tradingview.com/x/wpkKPE5F/I got a LONG-trade just now on Cryptocurrency QTUM / USD.I don't know much about it but it looks strong on the charts.You can see the bullish W/bottom which is
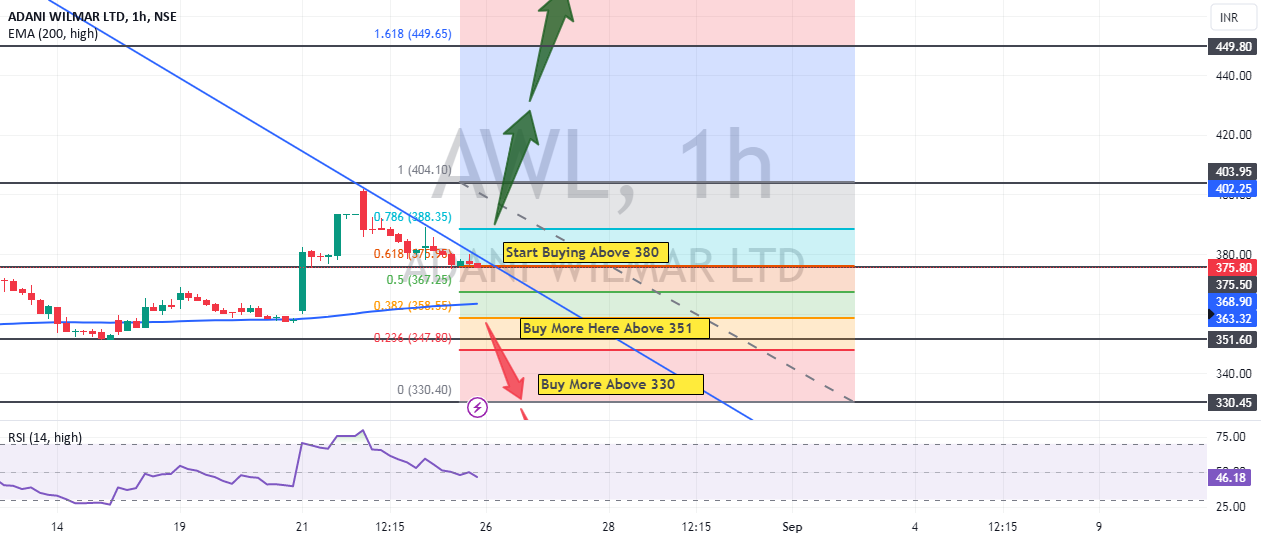
Technical Analysis of Adani Wilmar Ltd(AWL)- The technical analysis of Adani Wilmar (AWL) stock. It is created using the TradingView platform by the user "ForexTrader4all".Here's a breakdown of the information
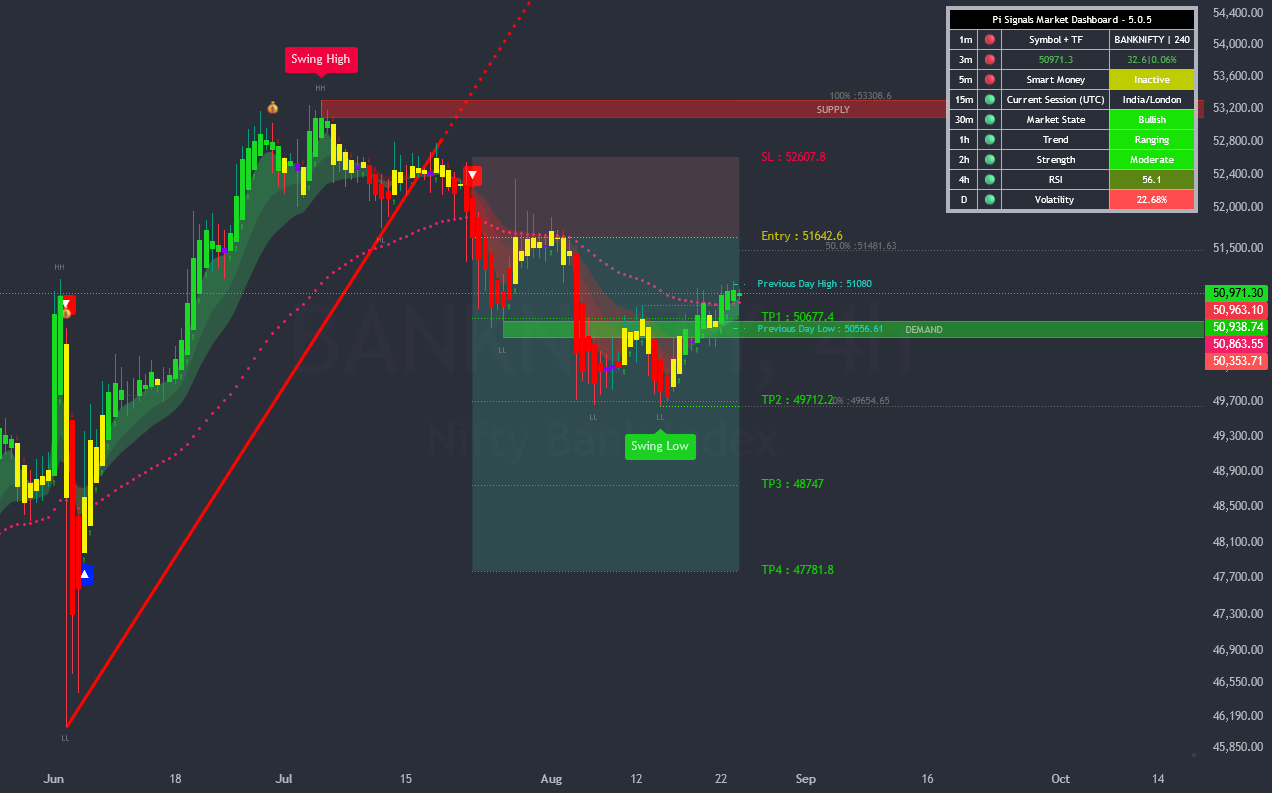
Analysis:The chart indicates a potential long (buy) position with a precise entry, SL, and multiple TP levels. The market is currently bullish, but the trend is ranging, implying that there