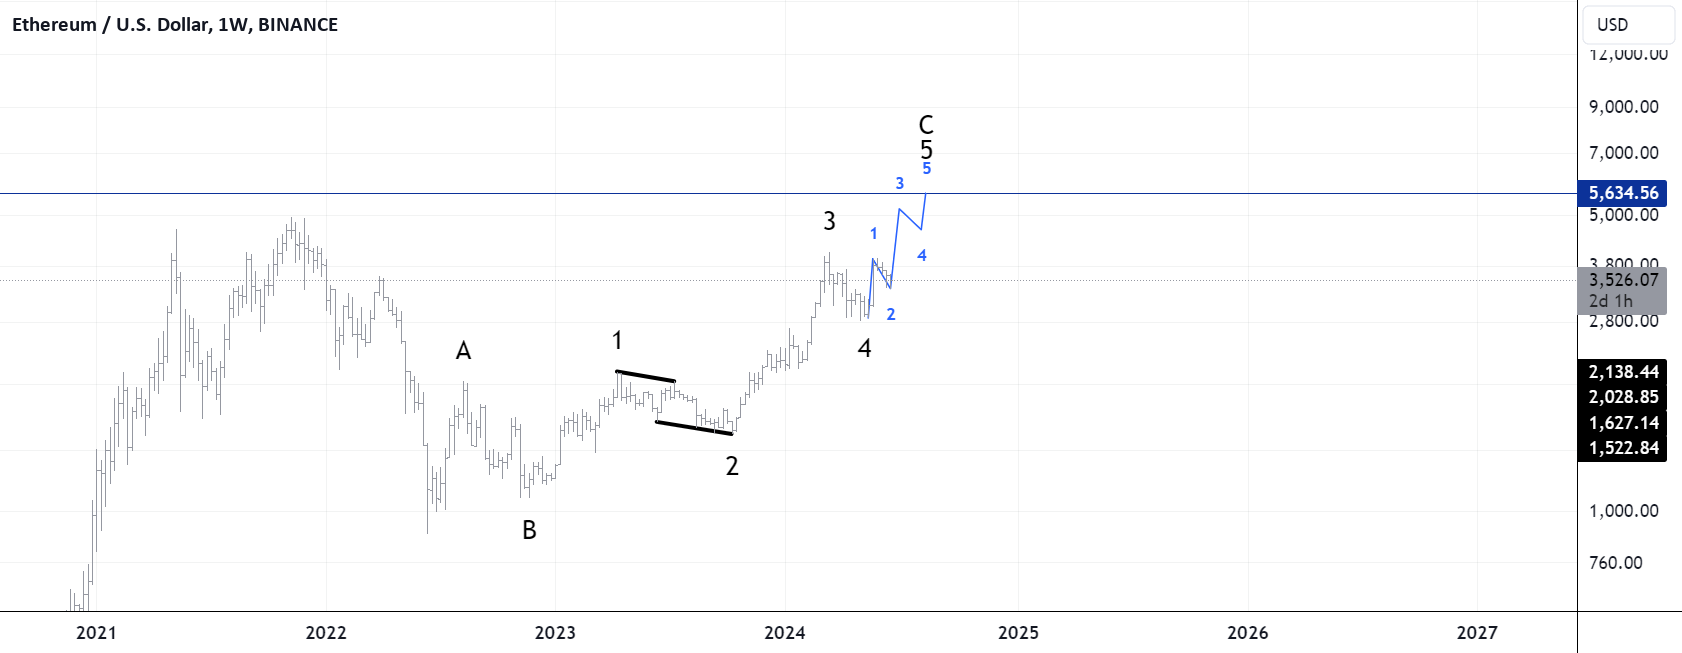
ETHUSD In this chart, we analyze the weekly price action of Ethereum (ETH/USD) using Elliott Wave Theory. The chart shows a clear wave structure, indicating potential future price movements. Wave
I see so many posting trades using an hour or 30 minute candles, counting waves like it is meaningful. It is not, it is simply amateur at best unless you
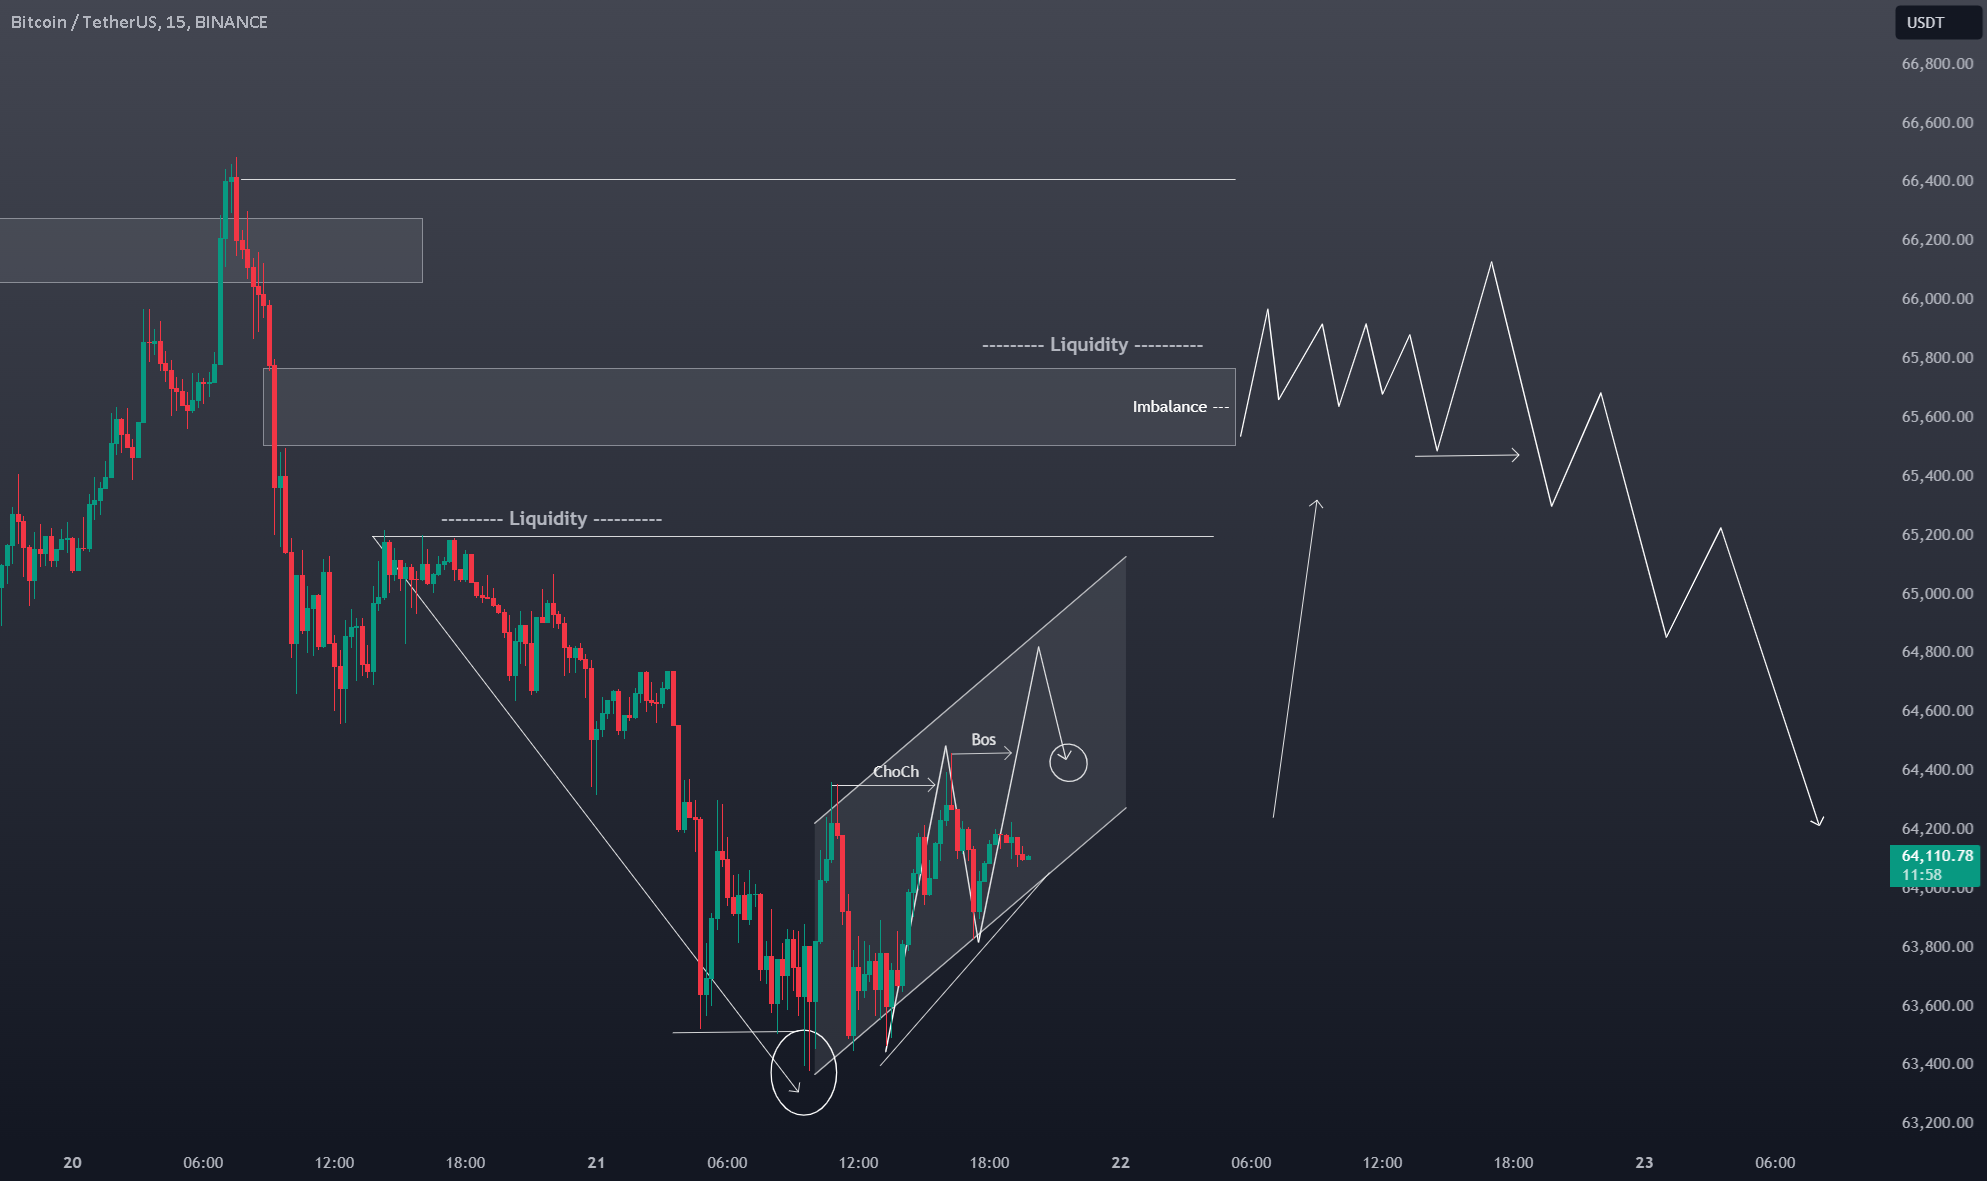
In this BTC Bitcoin analysis, we explore the higher time frame charts which currently indicate a bearish trend for Bitcoin. However, the price action on a 15m timeframe suggests a
GBP/USD Analysis and ChartsUK PMIs miss forecasts.UK government bond yields post multi-week lows.Cable below 1.2650, CCI indicator suggests GBP/USD is oversold. Recommended by Nick Cawley How to Trade GBP/USD UK
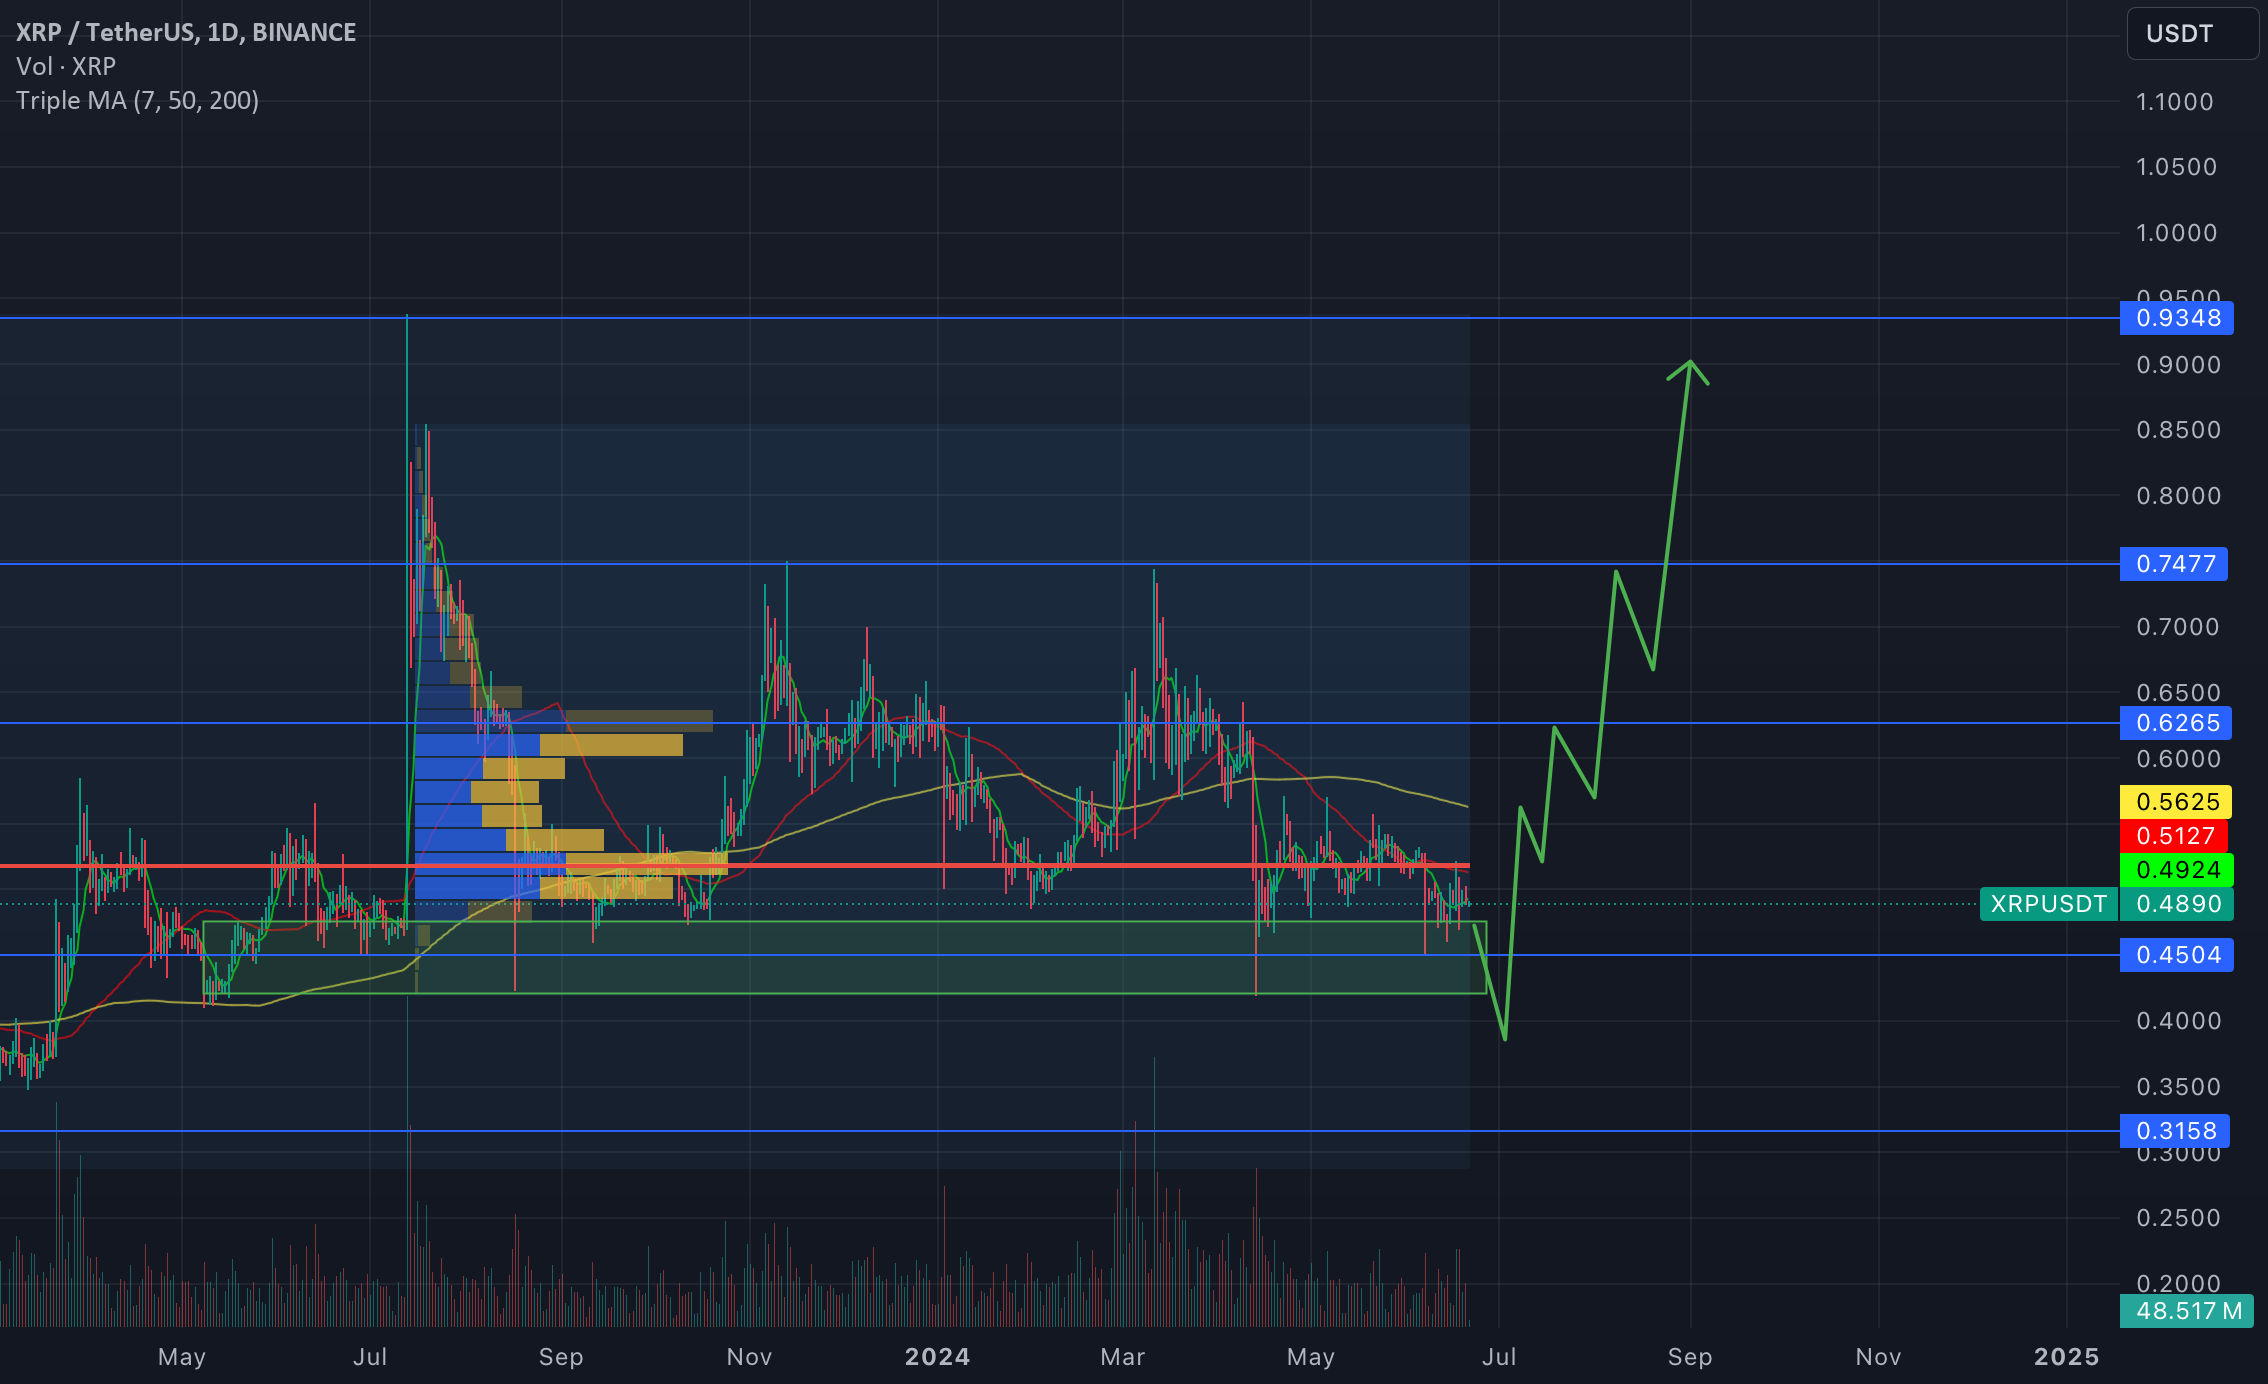
The XRP’s price has dropped to a significant support zone at the $0.4504 level. This is the fourth time the price has returned to this area. Historically, the price has
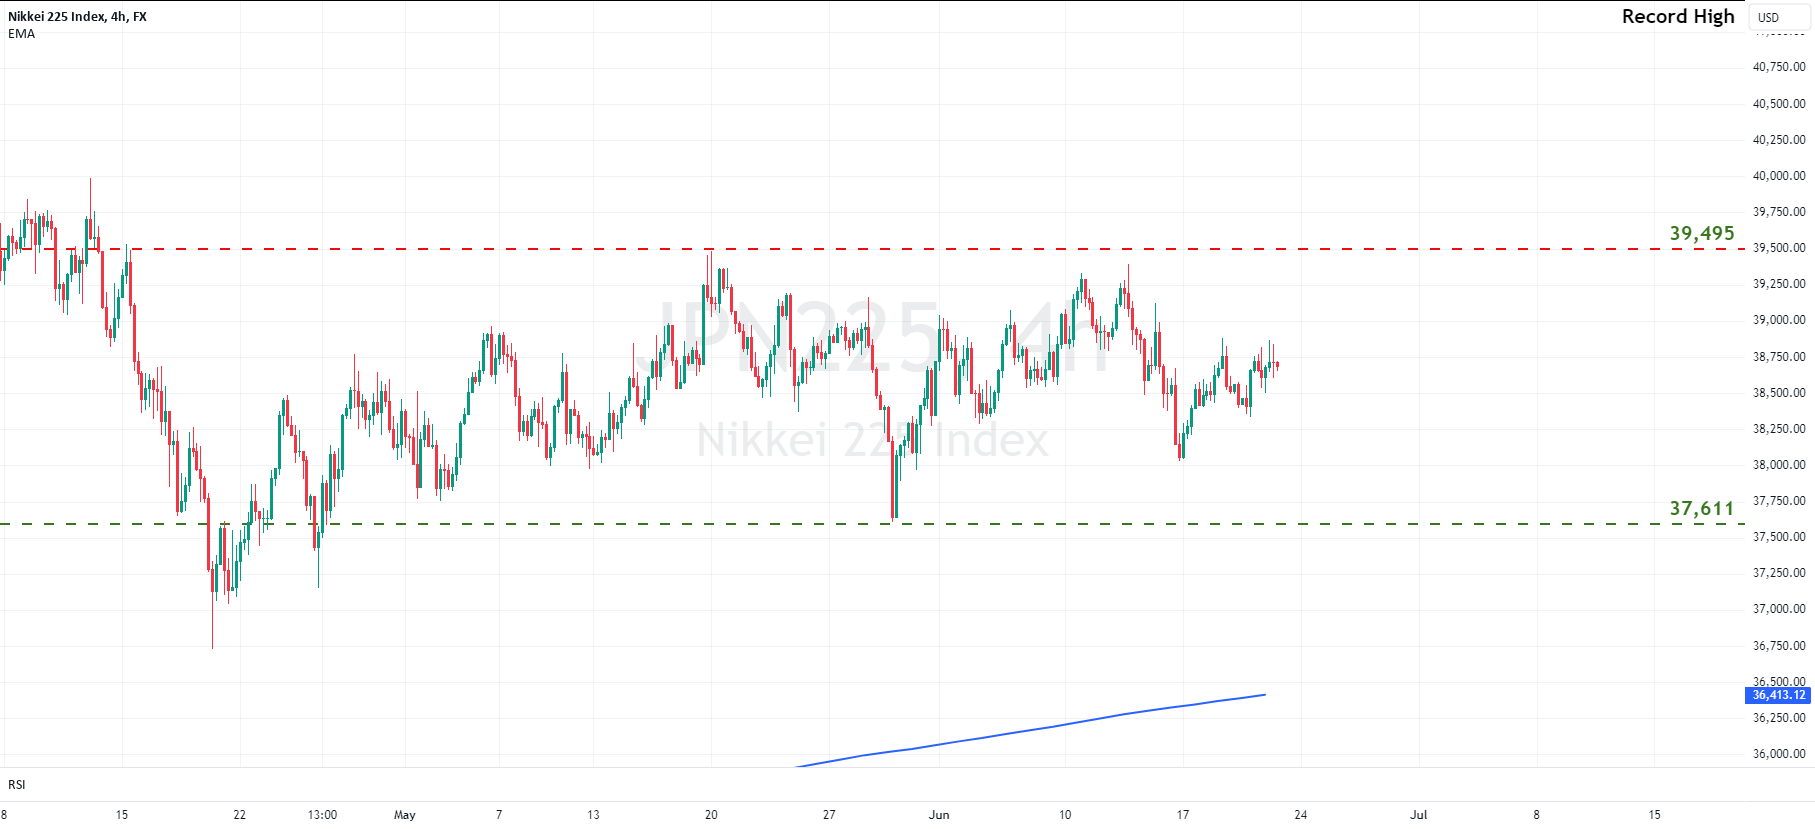
JPN225 has backed off its March record peak, as the central bank made a historic exit from negative rates, shifting away from the ultra-loose stance that has devalued the Yen
Market Week Ahead: US Data, Nasdaq 100, US Dollar and GoldA handful of high-importance US data releases may stoke volatility next week.Are the Nasdaq and S&P 500 in the process
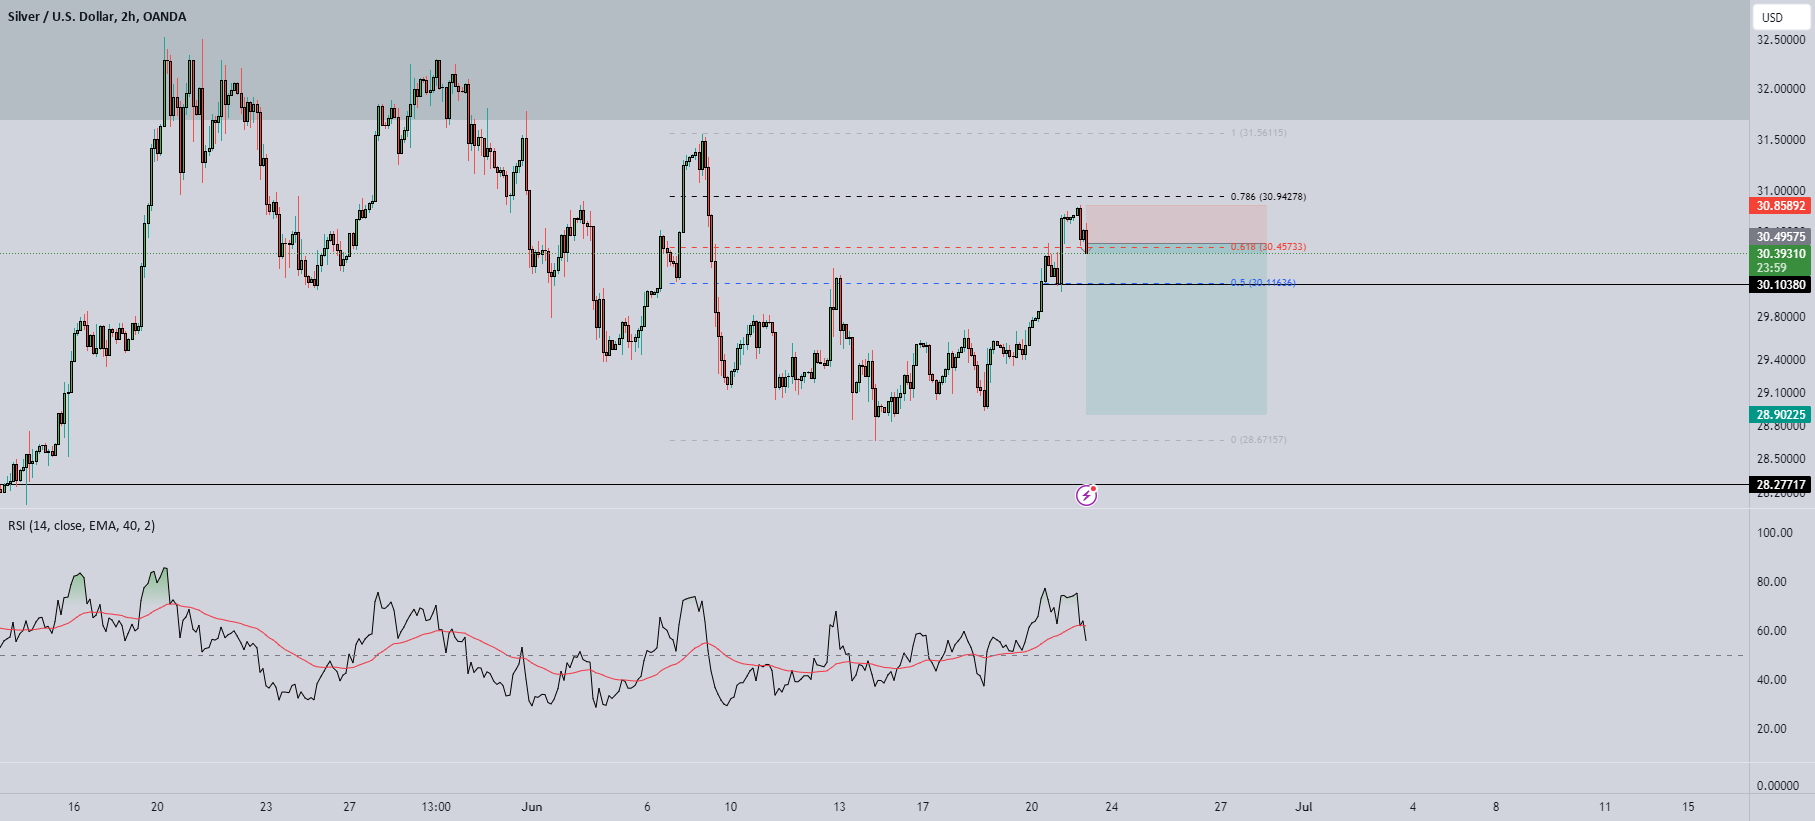
The market is currently testing the current structure which is forming a divergence on the 2HR TF. Based on price action , the market is forming a reversal chart pattern
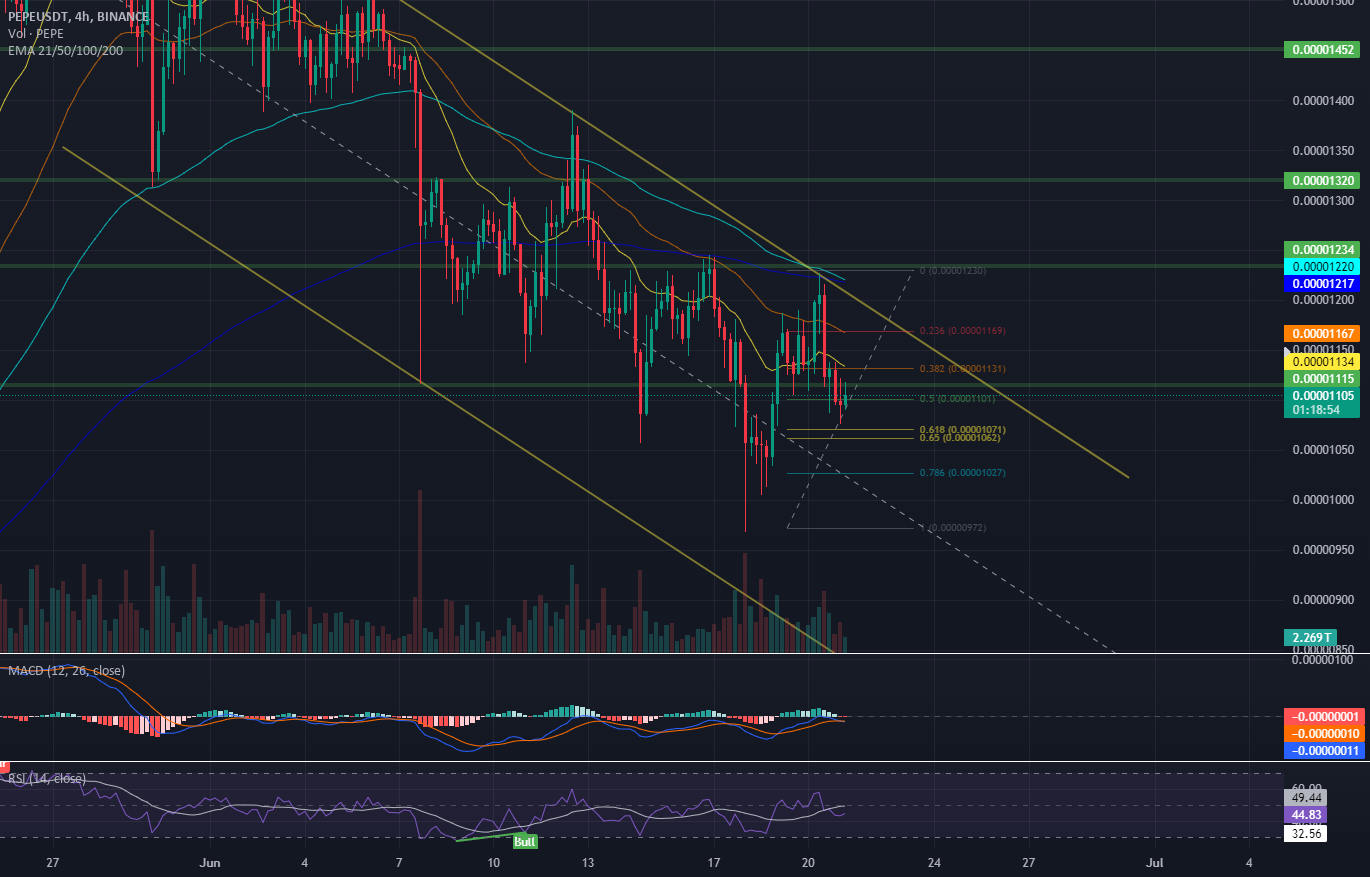
PEPE is in the huge Decending Chanel and it's almost weekend. What can we distract from the charts. Before we look into PEPE charts I've check BTC and we are
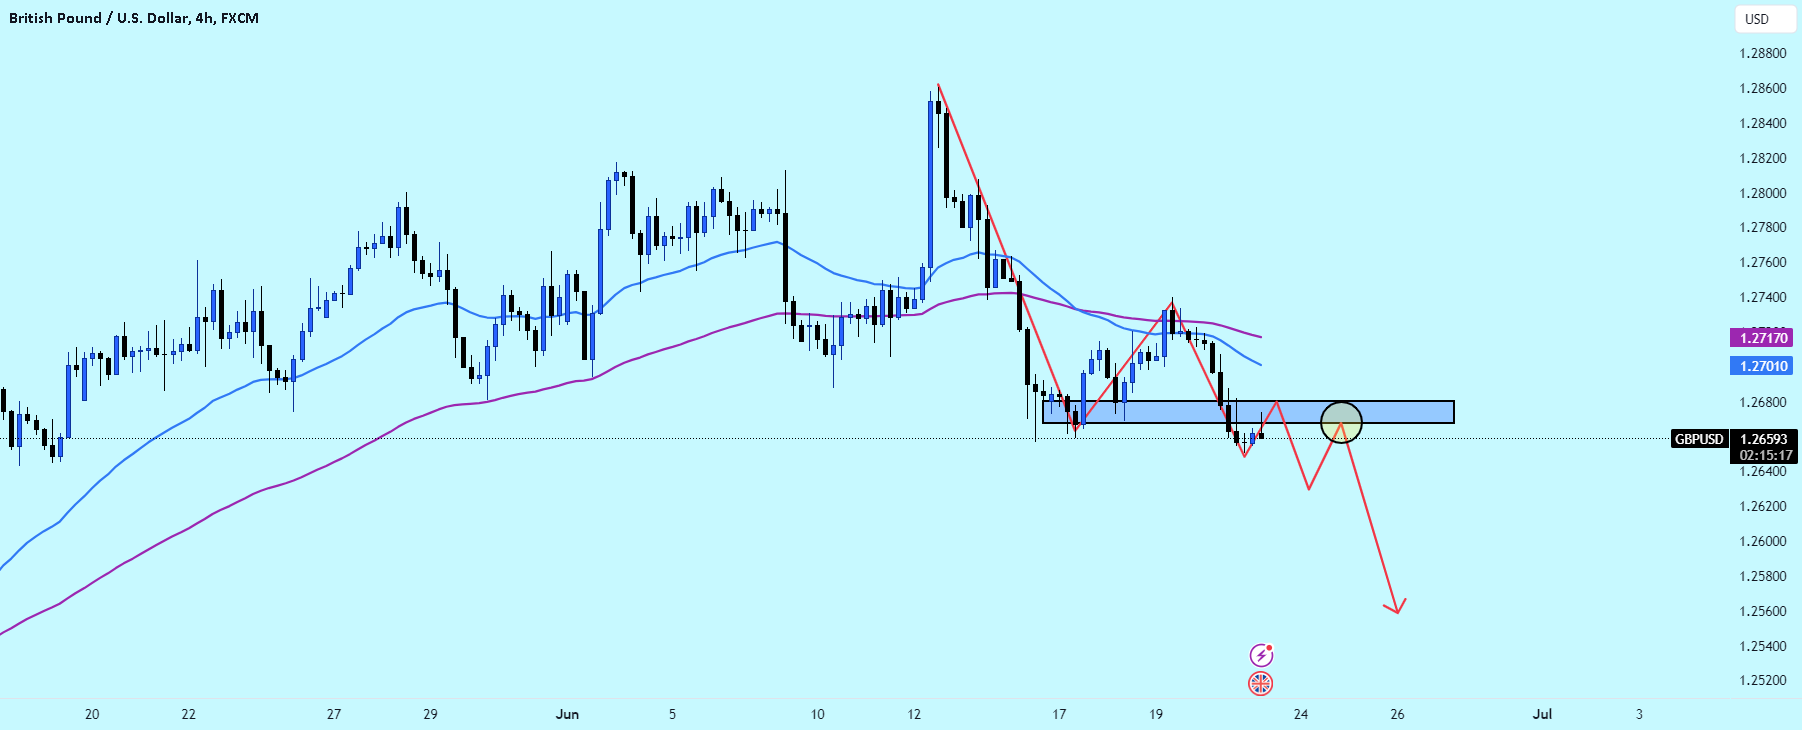
GBPUSD continues its downward trajectory, experiencing a significant drop towards the end of yesterday. Currently, it's trading around the 1.266 level, and sellers have successfully breached the support at 1.266.