USD prices trade at a major area of confluence that has held firm since May 2021 as core PCE deflator, durable goods orders and Michigan consumer sentiment looms.
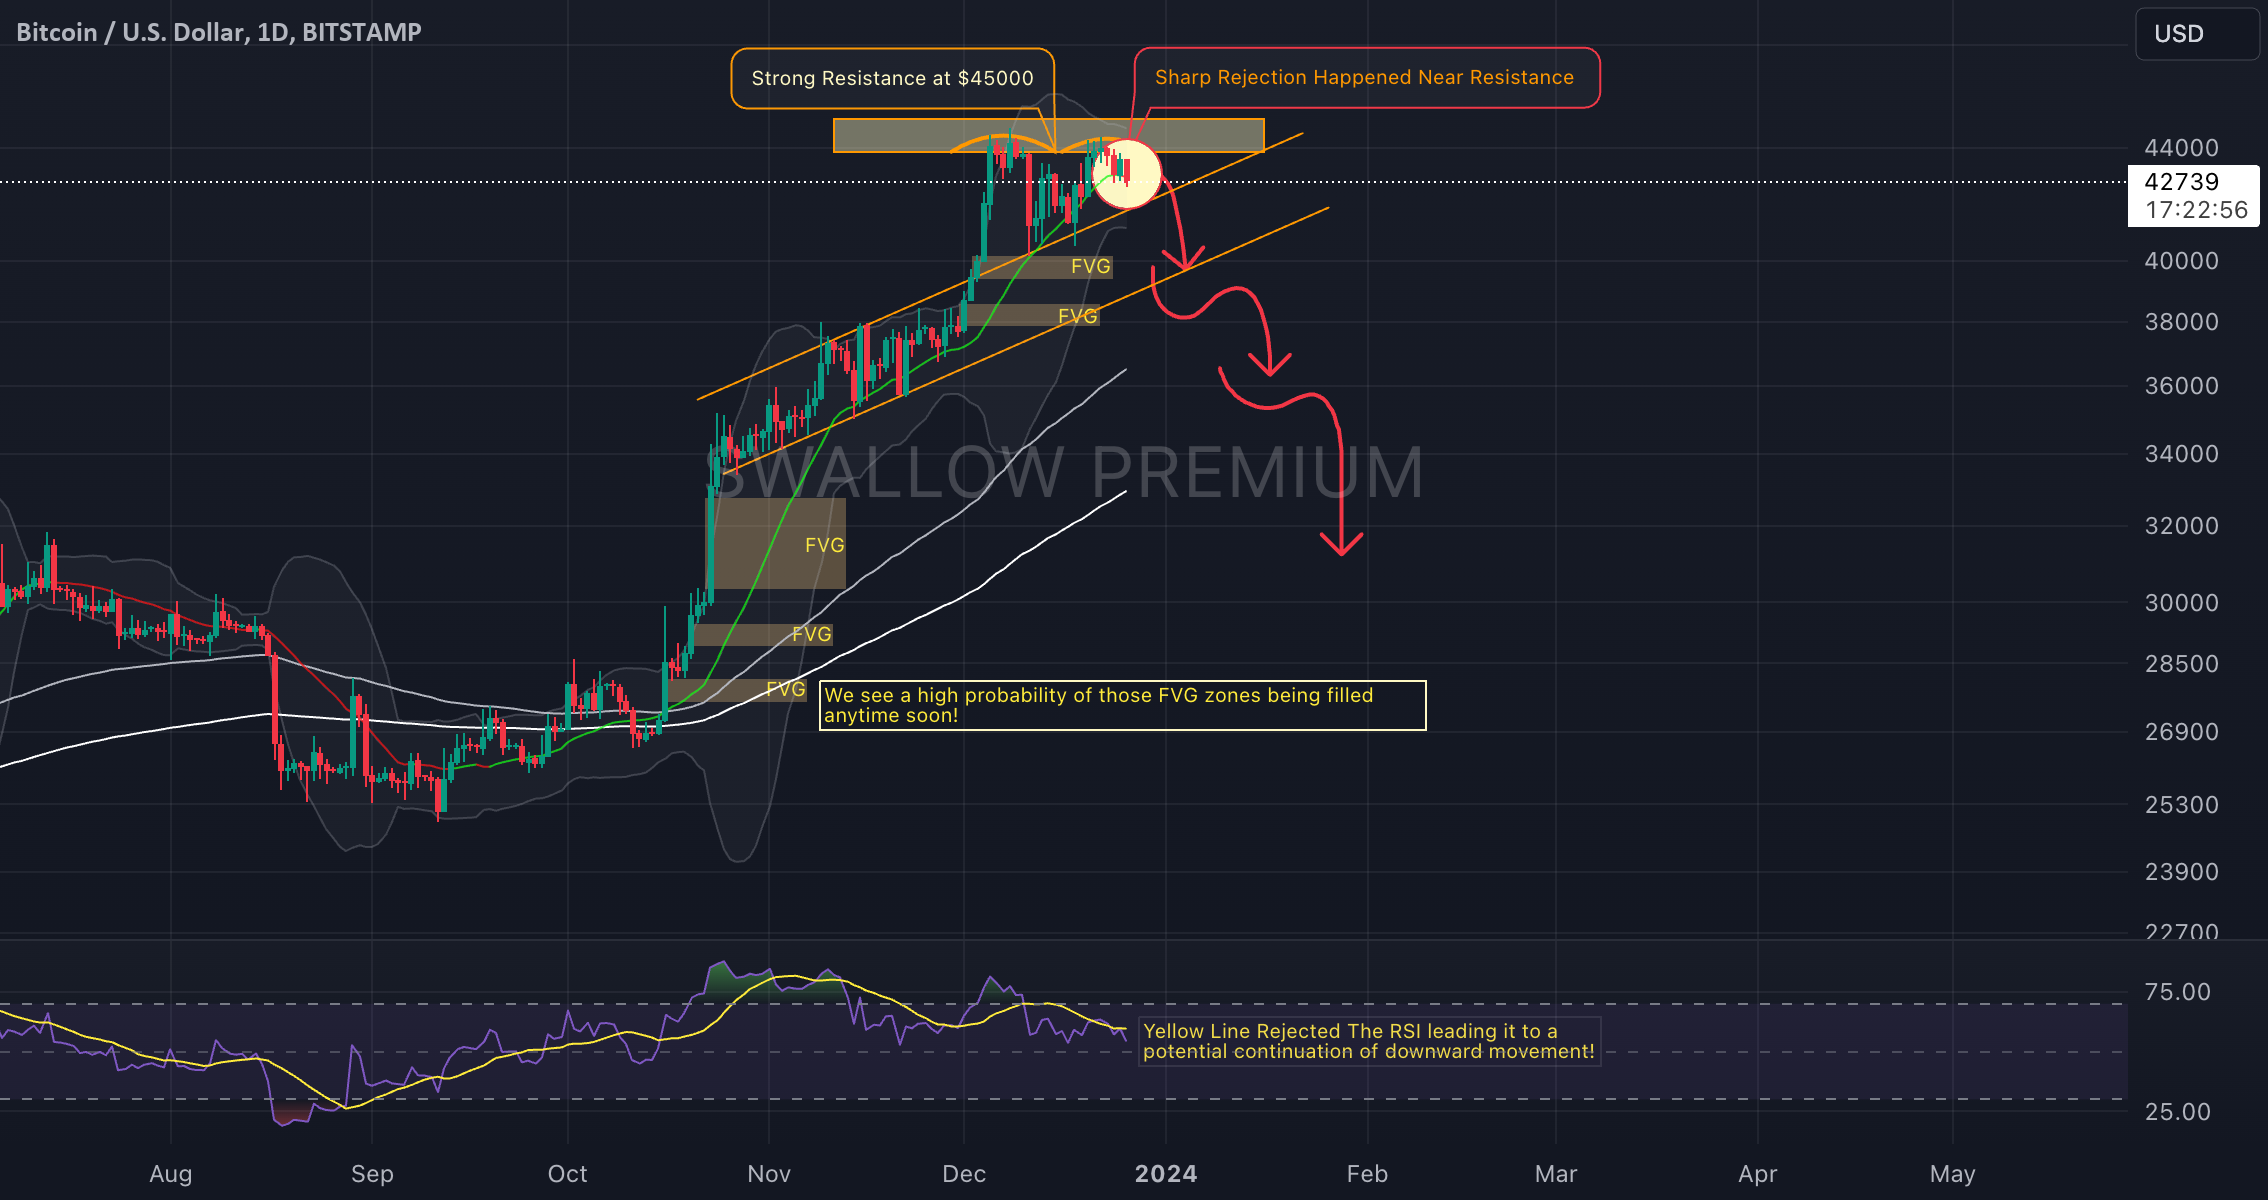
The second day has started with some sharp rejections near the upper resistance zone. With that nice rejection we have had, the price of BTC is also in the process
A weak US dollar is enabling EUR/USD to press ever higher and if today’s inflation report shows US price pressures easing further, the EUR/USD rally may continue into the year-end.