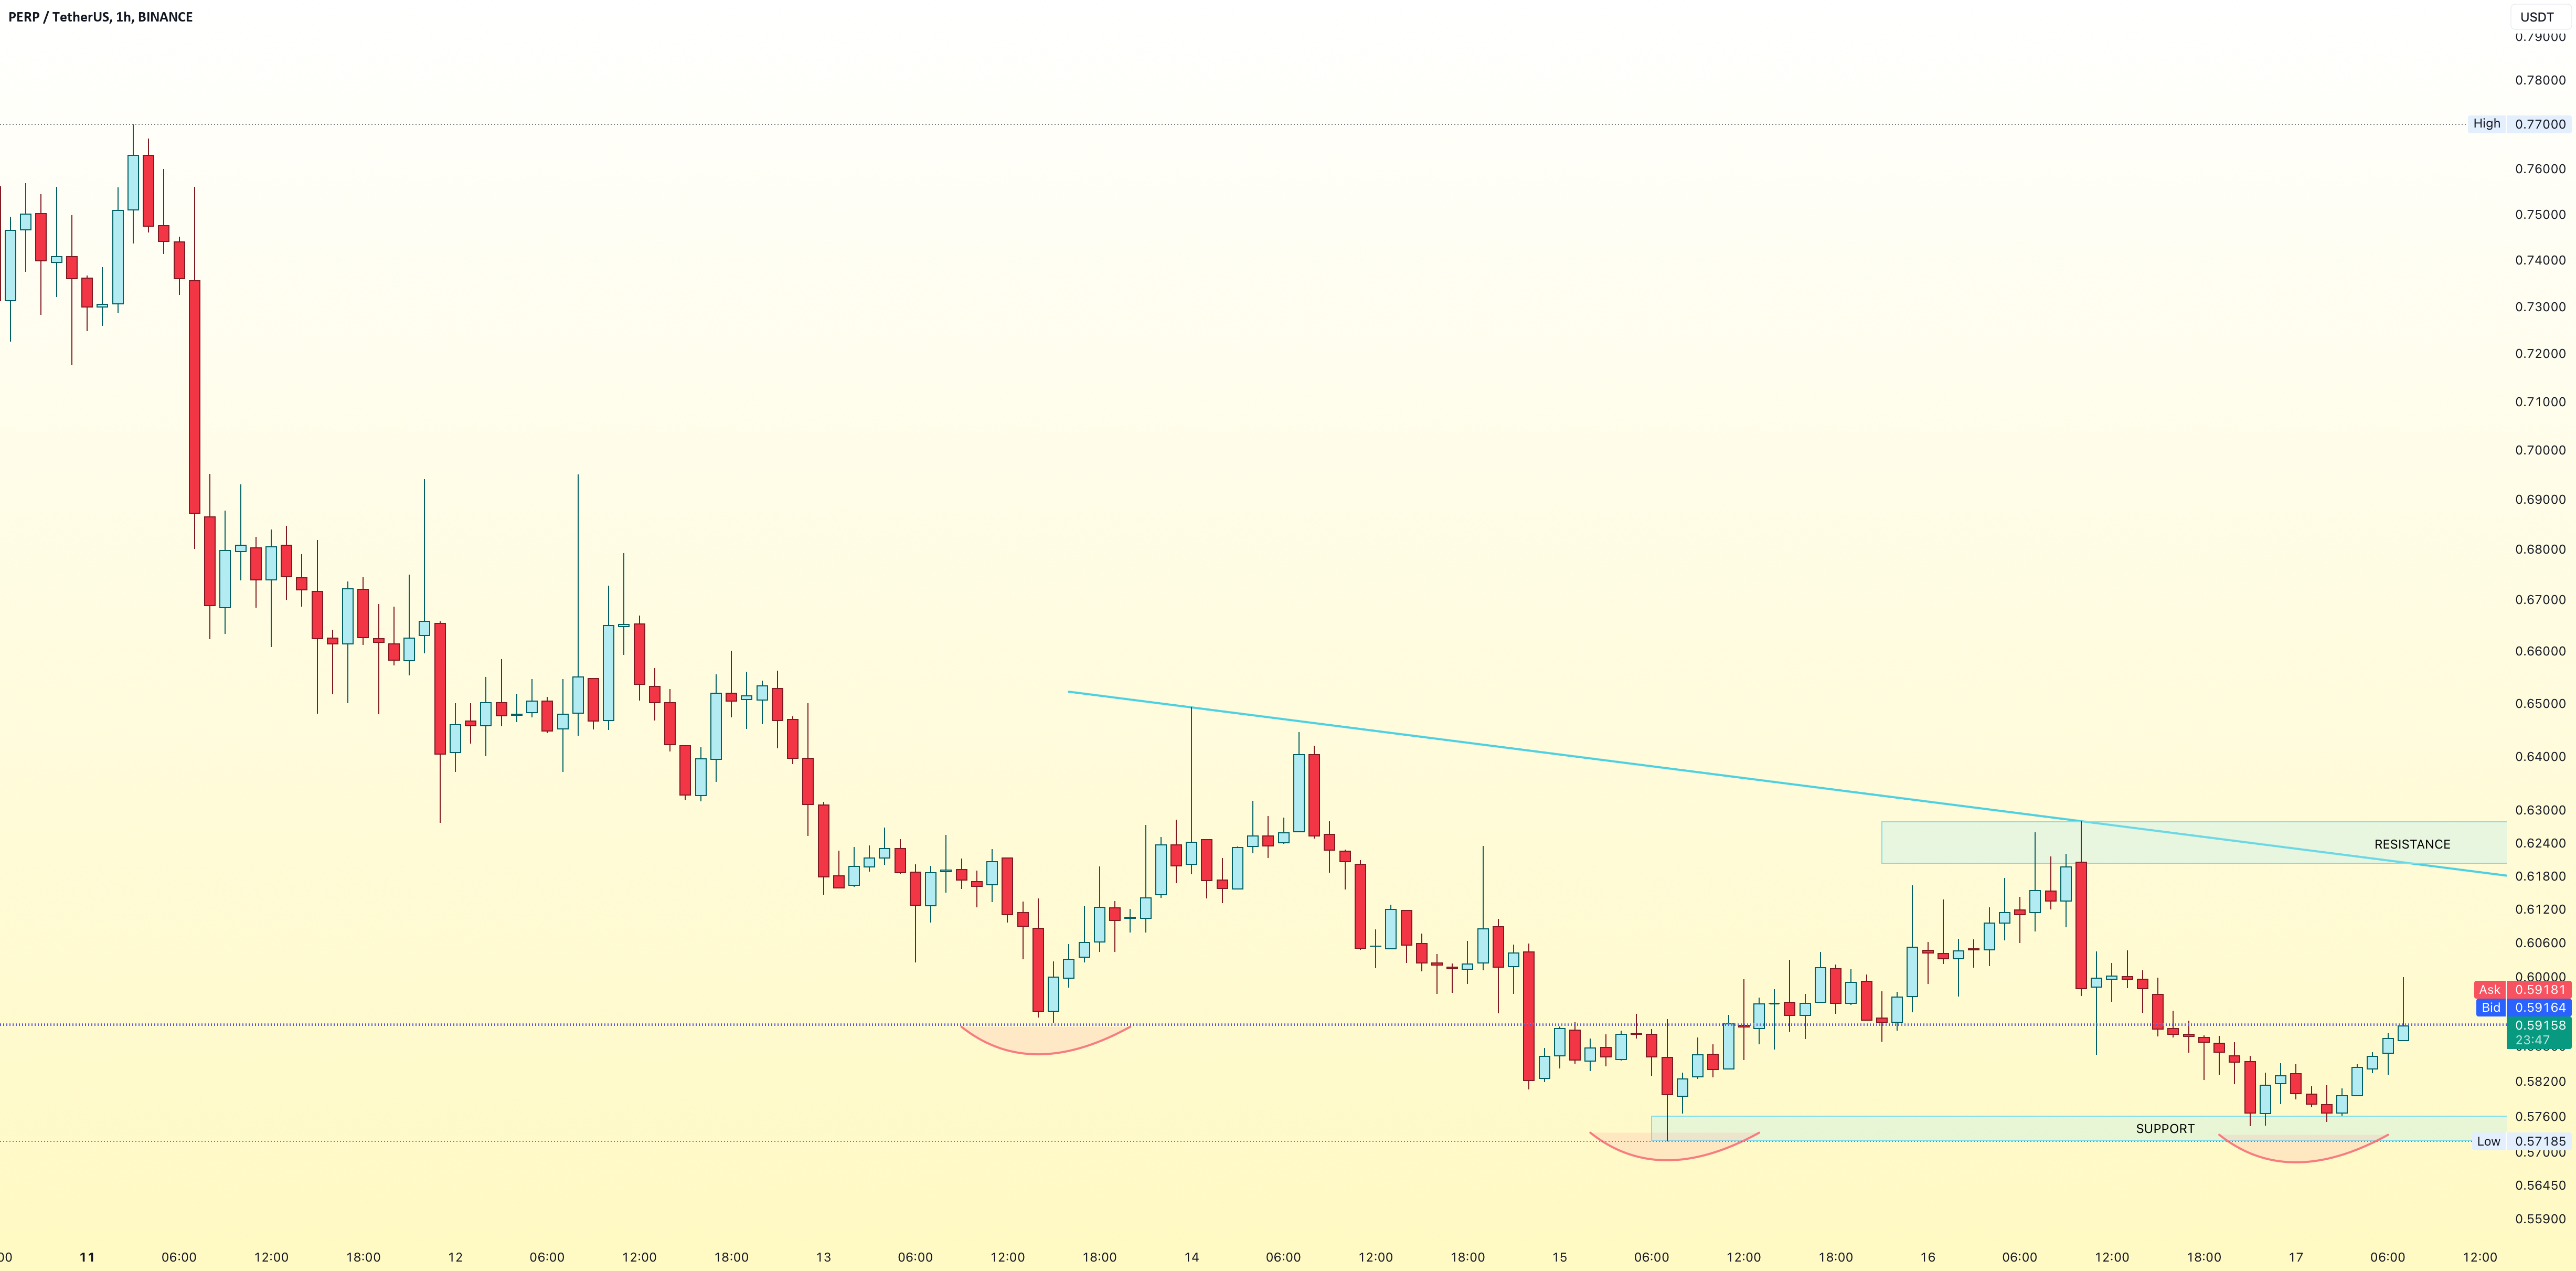
Chart 1H TF I figure out two chart patterns for now #1. Reversal Pattern which is Inverse Head Shoulders #2. Continue Pattern which is Triangle Pattern I more likely PERP
US EQUITIES TALKING POINTS:FORECAST: NEUTRALSP 500 Had a Back-and-Forth Week as the Indecision in Markets Continue.Nasdaq 100 Eyeing Triangle Breakout Ahead of the FOMC Meeting as Global Demand Concerns Heat
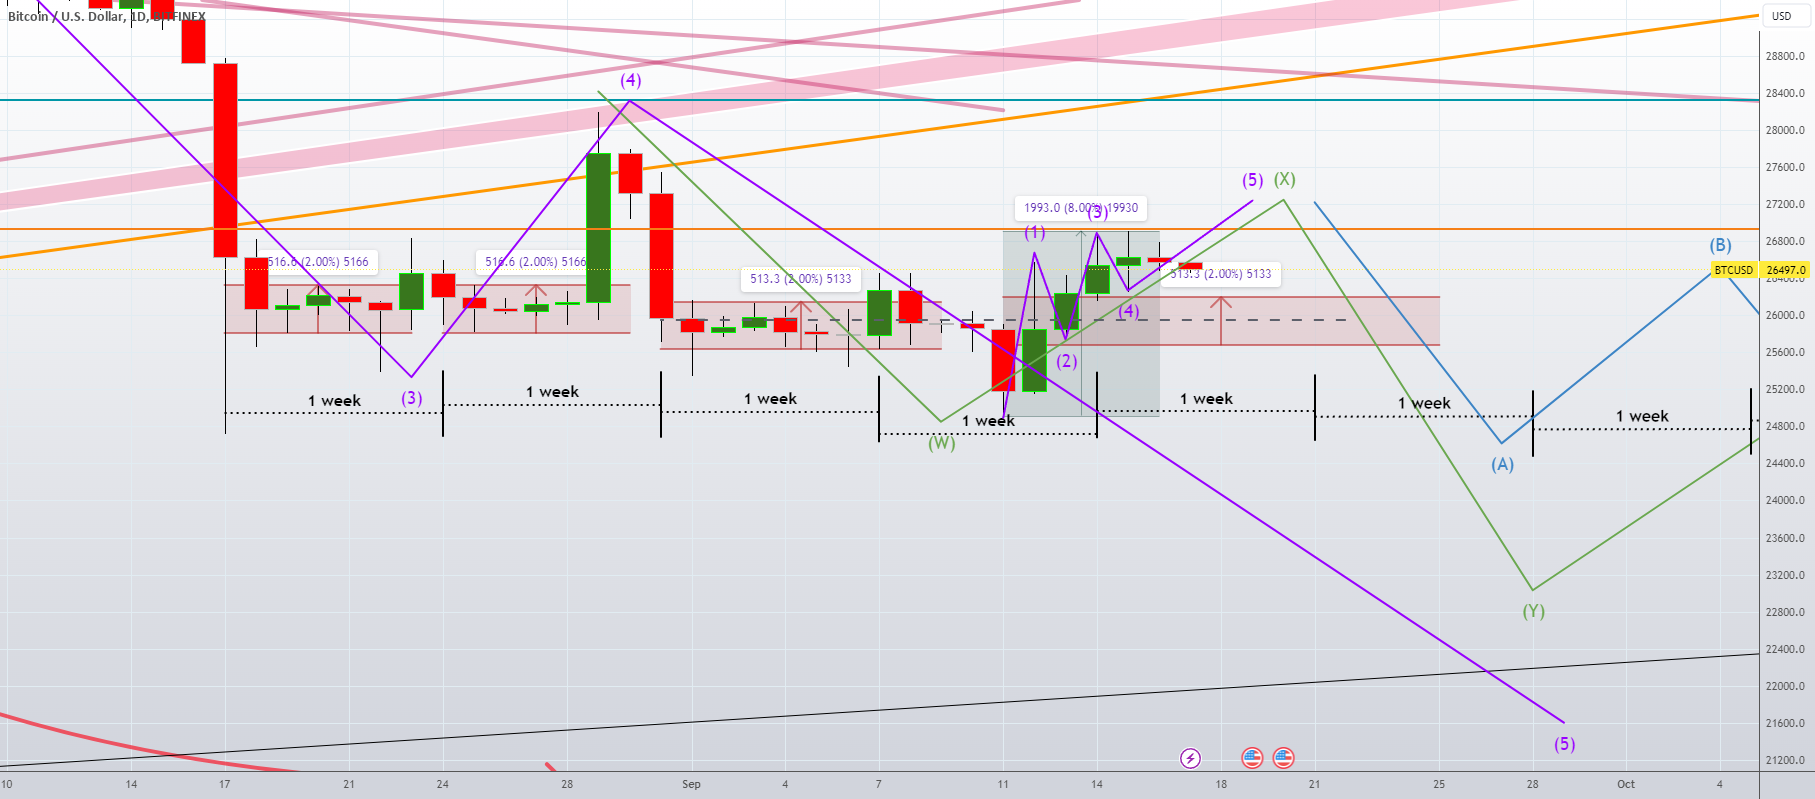
I never plan to be exact, feeling the bias downwards still. Loose plotting, not made to be exact and definitely not feeling like the math plotting. There is a notable
EUR/USD AND EUR/JPY FORECASTEUR/USD will exhibit heightened sensitivity to the FOMC monetary policy announcement next weekThe Fed is expected to hold interest rates steady, but may signal one more hike
Gold, Silver Weekly Forecast: BearishRisk factors lift gold but the FOMC projections present a massive challenge for goldSilver bounces off key Fibonacci level with 200 SMA in focusThreat of potential
Bitcoin (BTC), Ethereum (ETH) Prices, Charts, and Analysis:Talk of an imminent BlackRock Bitcoin ETF turns markets higher.BTC and ETH remain in multi-week ranges.The Bitcoin rumor mill was back in full
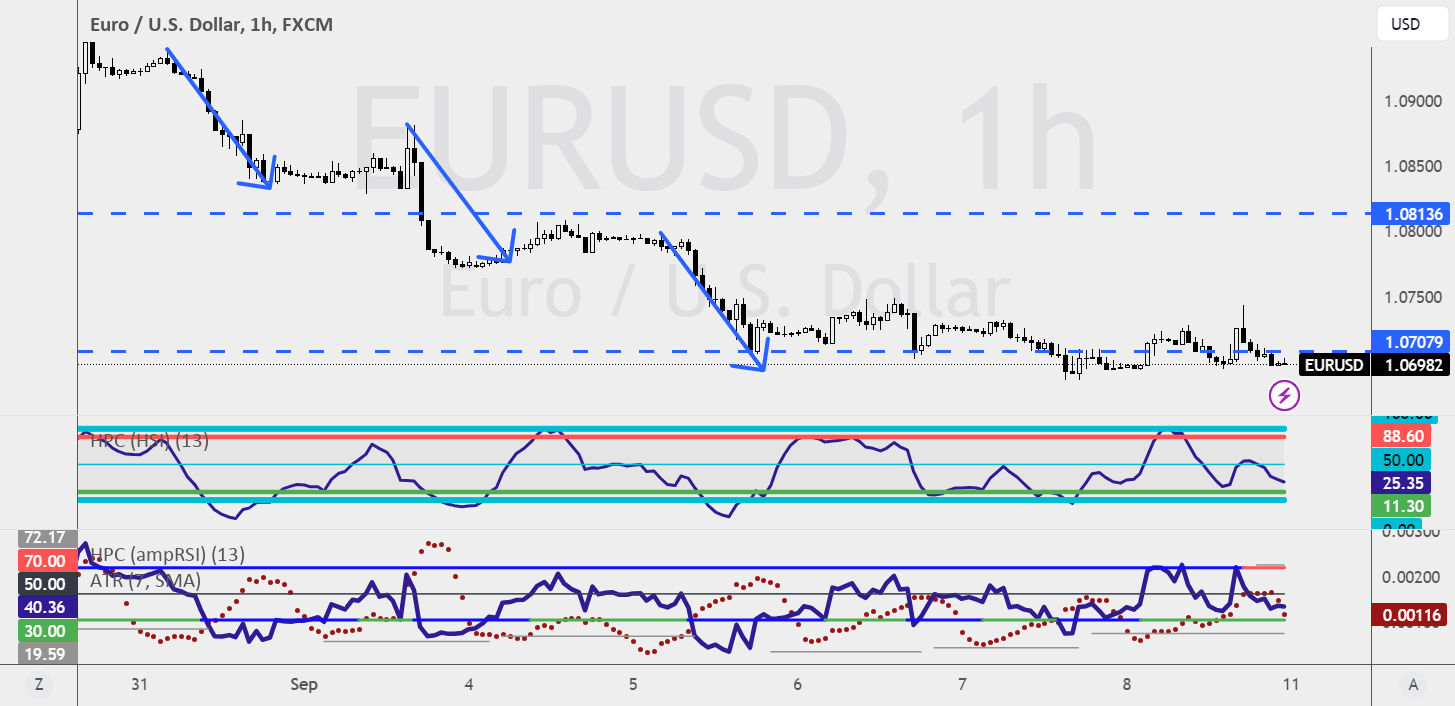
Diving into the EURUSD action, the weekly chart indicates a continuing bullish trend. However, before diving into a 1-hour buying opportunity, let's pump the brakes for two crucial reasons: RSI
GBP/USD and GBP/JPY Analysis and Charts Recommended by Nick Cawley How to Trade GBP/USD After testing 1.2800 earlier in the week, cable is pressing down on a prior level of
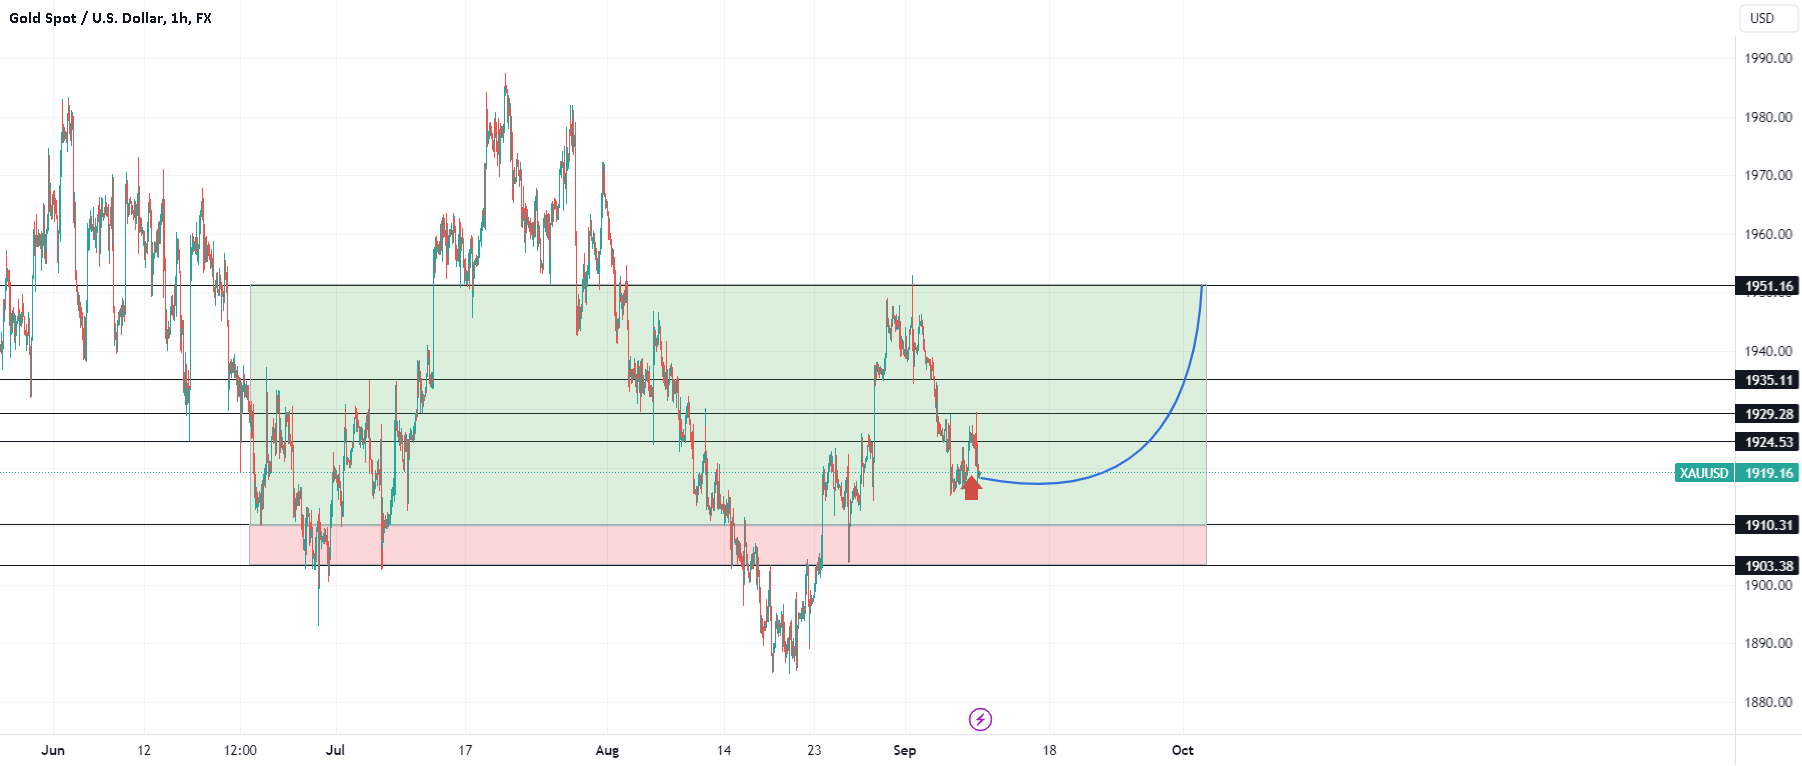
#XAUUSD | Bullish H1 Time Frame #xauusd seems to be rejected the upper higher of last week 1929 and rejected more then two time of lower 1915-1914 so Accordingly to
EUR/USD ANALYSISEUR struggles to capitalize on recent Fed speak.US CPI and ECB rate decision the key risk events for next week.Falling wedge breakout could bring some hope for euro bulls.