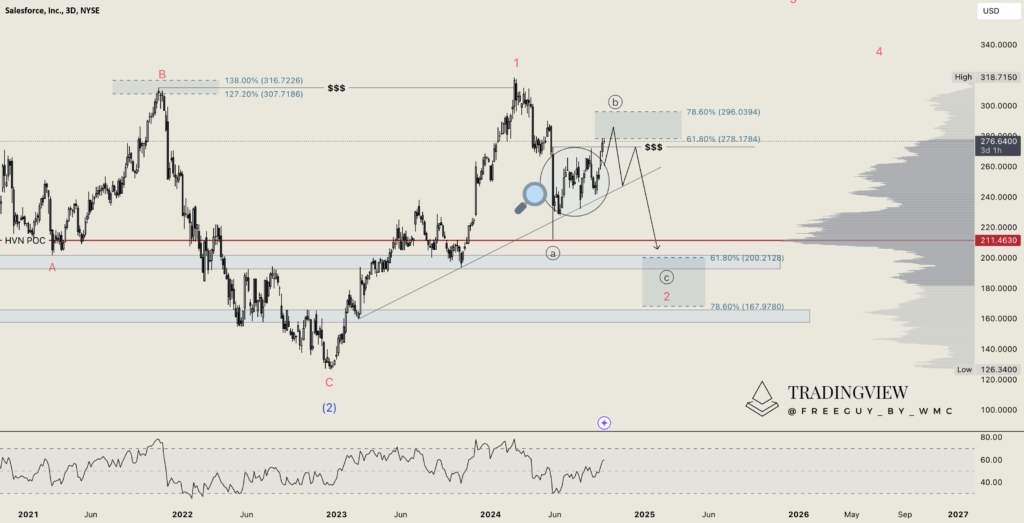
One of our members asked for an analysis on Salesforce (CRM), and we’ve taken a closer look at it. Initially, it’s a bit challenging to see the full picture, but if our Elliott Wave count is accurate, we marked the end of wave (2) at $115.29 after establishing wave B, which was exactly between the 127.2% and 138% Fibonacci levels.
It appears that wave 1 was put in with a new high slightly above wave B, taking out the resting liquidity (likely due to profit-taking and closing of long positions). Following this, there was a 33% drop, and here’s where it gets tricky. Normally, we would expect this decline to continue, suggesting that the current rise is merely a relief pump. However, wave ((a)) perfectly touched the HVN POC, which indicates a slight chance that this could be the bottom. That said, we still believe that a continuation down to the 61.8-78.6% Fibonacci level is more likely.
Zooming in on the blue-circled area, we notice a textbook bear flag pattern developing. While we don’t typically trade based on chart patterns, it is difficult to ignore this one given its clear structure. It becomes even more significant if there is a wick above the upper trend line of the flag, which could trigger another sell-off by taking out the liquidation levels. Such a wick would also fully close the gap and enter our targeted area where we anticipate a possible reversal.
To be clear, we are not trading this bear flag pattern or the targeted area just yet. Instead, we are using this setup as a means to validate whether our bearish outlook is correct or not. We’ll continue to monitor the development closely and provide updates as we gain more clarity.


