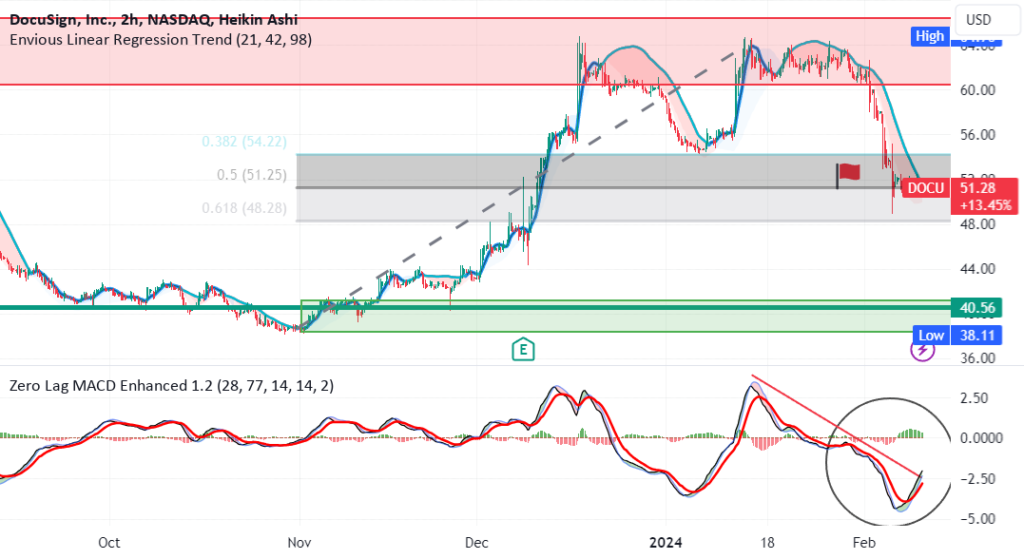
is shown on a 4H chart here. It have added supply and demand zones showing resistance and support. Price rose before and during earnings topped and fell in a shallow retracment and then reversed again topping and has now trended down into a full retracement turning into a “M” pattern. I added the retracement tool. On a lower time frame, price formed a bear flag pattern which could signal bearish continuation is likely. On the other hand, the zero-lag MACD indicator is bullish at its …

DOCU , a documents technology company for NASDAQ:DOCU by AwesomeAvani
is shown on a 4H chart here. It have added supply and demand zones showing resistance and support. Price rose before and during earnings topped and fell in a shallow retracment and then reversed again topping and has now trended down into a full retracement turning into a "M" pattern. I added the retracement tool.…
Shares:

