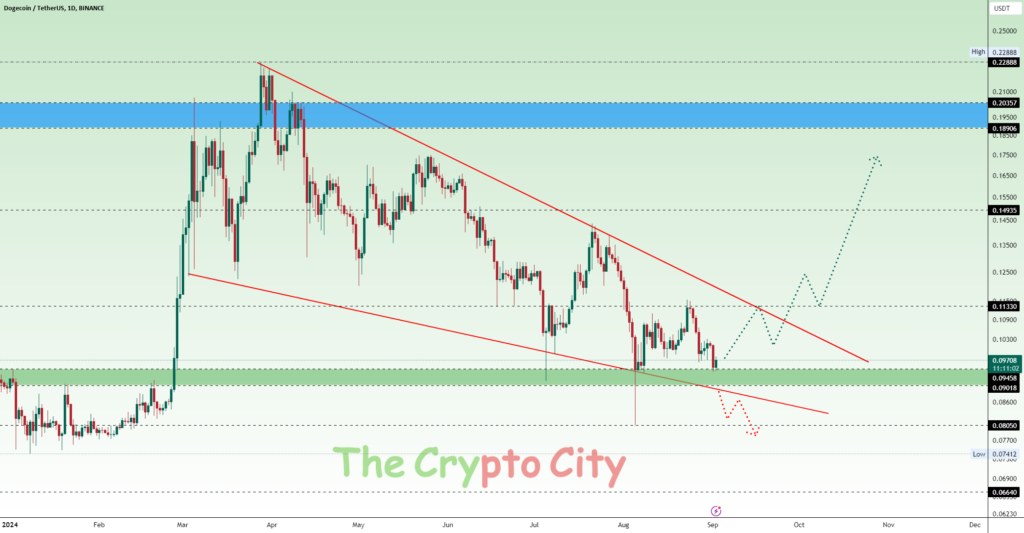
The DOGE/USDT pair is now in a bearish trend, with price action forming a descending triangle pattern on the daily chart. This pattern is identified by the construction of lower highs, showing a consistent loss of bullish momentum, and a horizontal support zone also maintains the price. The upper boundary of this triangle is marked by a descending trendline, which provides strong resistance. As the price reaches the triangle’s top, it is ready for a strong upward or downward move depending on the breakout direction.
The key support levels on the chart support zone (Green) at $0.09018 – $0.09458. This zone has proven to be a strong floor for the price, and a break below this area could signal a bearish continuation. Should the support give way, the next notable level to watch is $0.08050, which is a previous low. If bearish momentum continues, the price could further descend toward the $0.06640 mark, representing a significant drop from current levels.
On the flip side, if DOGE manages to break above the descending trendline and sustains a move above the resistance level at $0.11330, it would indicate a shift in market sentiment towards bullishness. The first target in such a scenario would be the resistance at $0.14935, a level that previously acted as a barrier for price action. Beyond this, the next significant resistance zone (Blue) at $0.18906 – $0.20357. These levels are crucial as they represent areas where selling pressure could re-emerge, potentially capping any bullish rallies.
DOGE is at a critical juncture within its descending triangle pattern. Traders should monitor the price closely as it approaches the support and resistance levels. A breakout from this pattern, either to the upside or downside, will likely dictate the next major trend for the pair. The overall market sentiment, along with volume and momentum, will play a crucial role in confirming the direction of the breakout.


