
S&P 500, Volatility, Dollar, Rate Forecast, Recession, CPI and Earnings Talking Points:
- The Market Perspective: S&P 500 Bearish Below 3,800; USDCNH Bearish Below 7.0000
- Fed Chairman Powell’s remarks and the NFIB business sentiment survey sliding this past session wouldn’t urge the S&P 500 nor Dollar into a productive trend
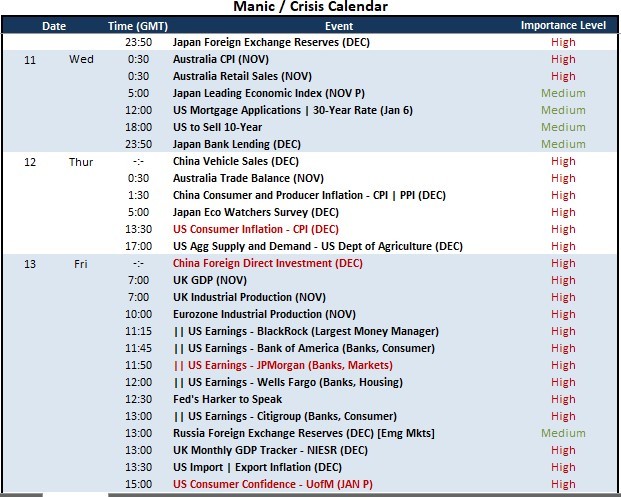
- Macro focus will shift further out to the Thursday CPI release and Friday bank earnings, and the distraction may create difficult trading conditions for Wednesday
Recommended by John Kicklighter
Get Your Free Top Trading Opportunities Forecast
At this juncture, the markets are registering healthy volume with open interest in derivative assets back up to levels approaching normal. It seems we have left the holiday conditions behind, but we are still lacking for a clear trend in the undercurrent of speculative appetite. That shouldn’t come as a surprise given that during the downtime for trend development, the skepticism around central banks’ commitment to inflation has risen while concern over an inevitable recession has slackened. That complacency isn’t the same foundation for an unconstrained bullish drive like it was just three years ago, but it is effectively taking the wind out of the bears’ sails. Now, the curb on traction is a more immediate factor. There is key event risk on the immediate horizon which has proven history of moving the market over the past few quarters. It would not be a stretch for market participants to set aside interim turbulence (otherwise referred to as ‘noise’) and await a stronger signal.
Meanwhile, the markets are following the expected cadence of a shift from motivation to anticipation. Friday’s unexpected rally from the US indices following the modestly better than expected employment figures and sharp drop in service sector activity turned into clear reticence with Monday’s intraday reversal and now this past sessions bounce. The modest 0.7 percent climb from the S&P 500 measures up to uncertainty while both holding the combination of the 20-day and 100-day simple moving averages though it in turn pushed to technical acuity of the former head-and-shoulders support (November 11th to December 14th). In the wash before major event risk, we can see thinner liquidity, higher volatility and an erosion in the solidity of technical barriers. This is a good time for introspection.
of clients are net long. of clients are net short.
| Change in | Longs | Shorts | OI |
| Daily | -4% | 13% | 3% |
| Weekly | 12% | -18% | -4% |
Chart of the S&P 500 with Volume and 100-Day SMA (Daily)
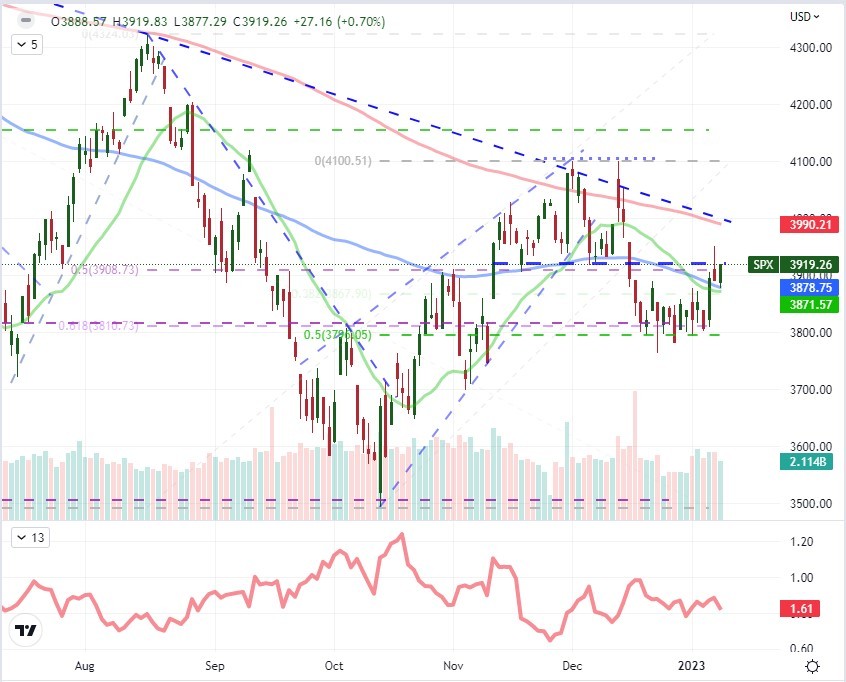
Chart Created on Tradingview Platform
With anticipation picking up, I would expect the major volatility indicators to start to swell; but that is not really holding true. The VIX volatility index – the standard – actually dropped 1.4 handles (6.3 percent) this past session to a December 21st low. This is still well within the past year’s larger wedge, but it doesn’t really line up to expectations. There are few contributions to this unexpected push including the fact that there is much more trading in options as directional trades (rather than hedges to the underlying S&P 500) as well as the 30-day duration behind the index. Most of the index-based, shorter duration volatility measures have been shut down and speculative replacements are not well made. The VXX short-term volatility ETN hit a new record low this past session as it continues to bleed value more owing to the way it was calculated than its actual reflection of market conditions. A little more interesting is the ‘volatility of volatility’ VVIX Index was briefly above 77 but went right back to the floor of what I consider ‘sitting duck territory’. The market remains ill-prepared for difficult conditions regardless of the event risk ahead.
Chart of the VVIX Volatility of Volatility Index Overlaid with the VIX (Weekly)
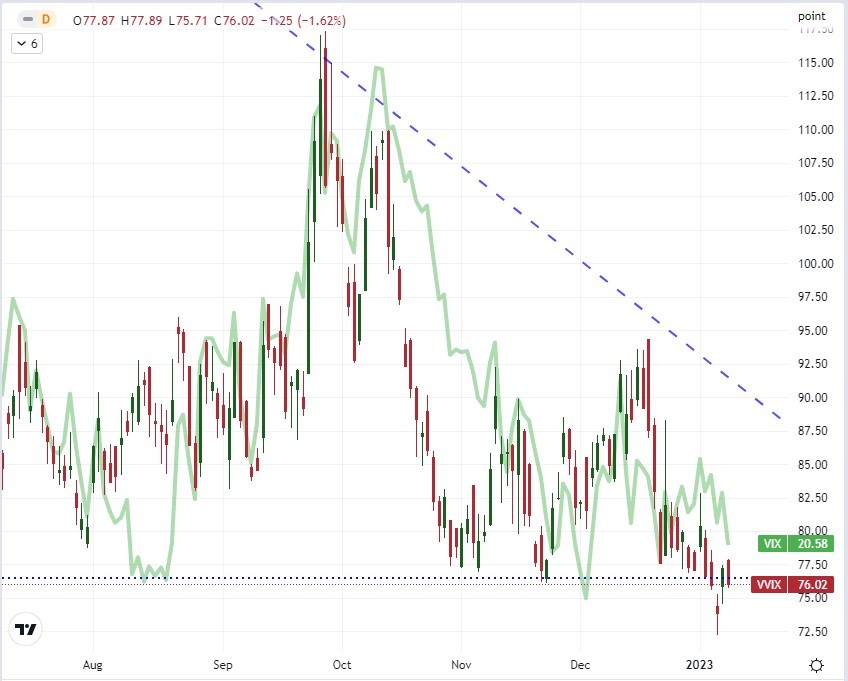
Chart Created on Tradingview Platform
Fundamentally, the markets had a chance to grasp on to a key fundamental theme this past session. There was of course the Fed Chairman’s remarks in which he would reiterate the central bank’s commitment to fighting inflation while holding to the forecasts they issued just last month. And yet, the market is actively rejecting those views with skepticism. It seems the Fed once again has a credibility problem. The more interesting theme on my radar was the perspective of the US economy. Adding another notch to the run of problems from inversion of the US 2-10 curve, last week’s IMF warning and the ISM service sector tumble; the NFIB’s business optimism survey dropped in its December update. It is holding just above the low set in June – which is itself the lowest reading of confidence in 10 years. I believe we will return to this theme, but perhaps not until the bank earnings can unnerve more of the market.
Chart of US 10-Year to 2-Year Yield Spread, NFIB Business Optimism and S&P 500 (Monthly)
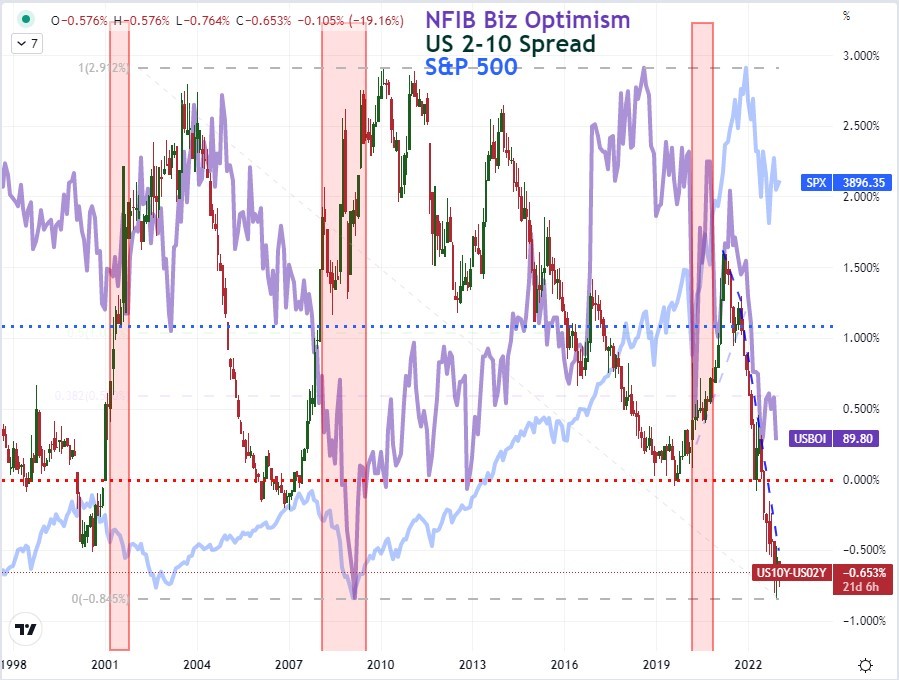
Chart Created on Tradingview Platform
Looking out over the next 48 hours of trade, there is a dearth of high profile event risk. Wednesday’s trading session will be particularly tepid relative to the expectations of the final 36 hours of light left in the trading week. That is likely to translate into the difficult conditions mentioned above. If there is a significant move between now and the US CPI release Thursday morning Washington time, we should really eye it with skepticism.
Top Macro Economic Event Risk Through Rest of the Week
Calendar Created by John Kicklighter
With the market loosing its traction, a measure like the S&P 500 which is bouncing between levels in its broader range, there is seemingly less at stake. The same is not necessarily true of the Dollar in the FX market. The DXY Dollar Index has stalled out right on the verge of fresh multi-month lows. Just below the measure is the former high from the post-pandemic highs at 103.00, which will likely receive a boost of influence due to the lack of conviction to be found. This will disrupt other ‘majors’ like EURUSD where many are eyeing the 1.0750 level as if it will either break or reverse hard at any moment. I would eye it with skepticism.
Chart of DXY Dollar Index Overlaid with US 2-Year Yield (Daily)
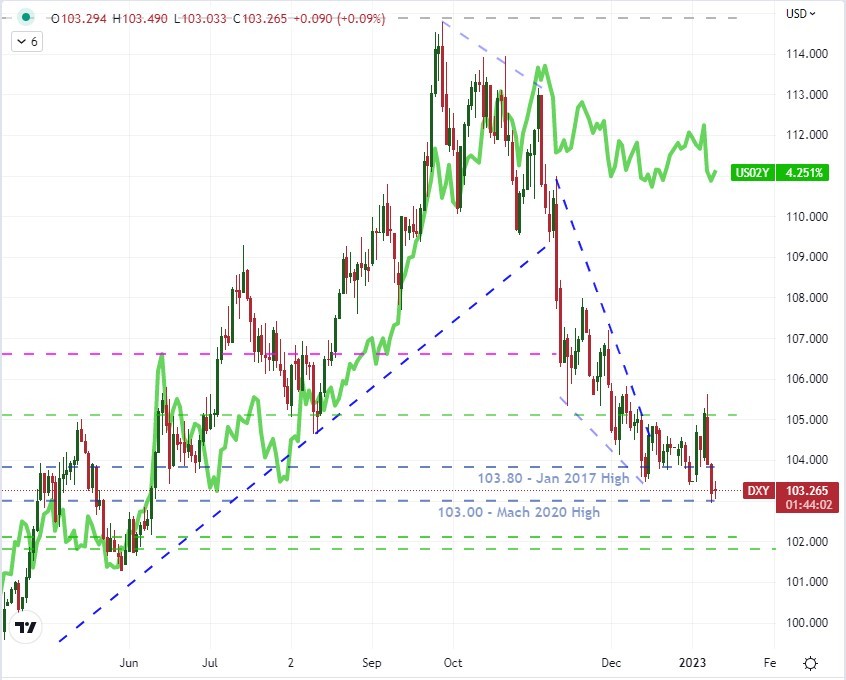
Chart Created on Tradingview Platform

Discover what kind of forex trader you are

