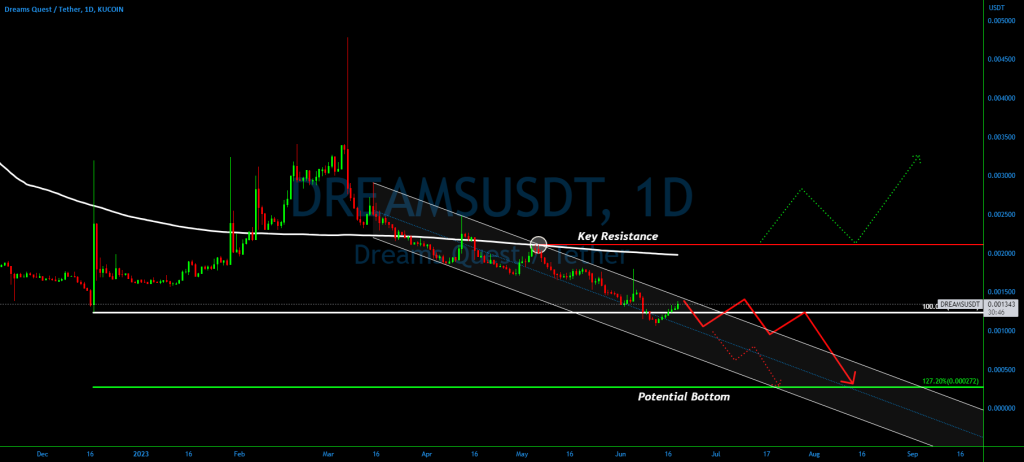
#DREAMSUSDT has been caught in a persistent downtrend for the past three months, showcasing a remarkable 80% decline since its peak in March. However, there are intriguing possibilities that suggest we may witness another substantial drop of similar magnitude.
The recent break below the long-term support level has triggered a pullback in #DREAMS price. As the current price approaches the upper boundary of the descending channel, it presents a potential selling opportunity. Staying within the channel would indicate a high likelihood of the downtrend continuing.
Notably, the nearest long-term Fibonacci support lies at the 127.2% level, which stands at a staggering 80% below the current price. This level may attract investor interest as a potential bottoming area. A breakout above the channel does not automatically signify a bullish trend, instead, it could potentially prolong the consolidation phase before the downtrend resumes.
To gain confirmation of a bullish trend, #DREAMS must successfully breach the key resistance levels highlighted on the chart. Only then can we anticipate a shift in market sentiment favoring the bulls.


