
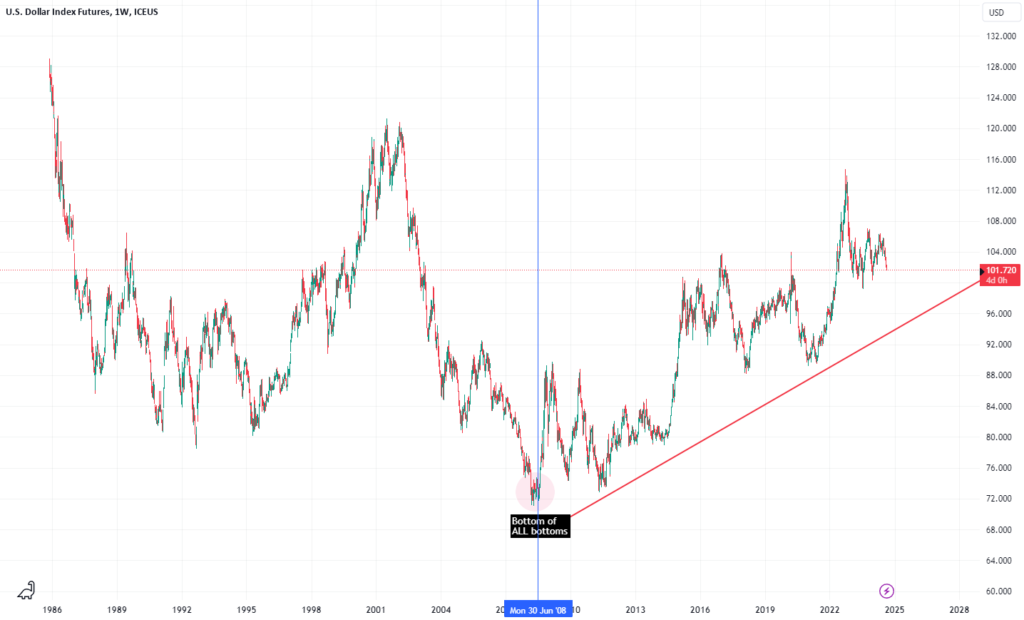

The Dollar Index (DX1!) has been in an uptrend since the spring-summer of 2008, when it reached its lowest point.
Since October 2009 (after the first leg down of the uptrend), whenever the net positions of retailers in the CoT report turn negative (or approach zero) AND retailers reach an extreme low in the CoT index (either in the short-term OR long-term), a significant run-up typically follows. Please note that these are weekly charts.
The only exception was in June 2020, when the price continued to decline until later that year in December, which ultimately led to a substantial 2-year uptrend.
At the same time, the 5, 10, and 15-year seasonality indicators show that we are currently at the bottom, which is expected to last until the end of September, suggesting an uptrend.
Additionally, there is a weekly demand zone ahead around 101.400 – 100.320. If enough participants join in, a significant run-up is expected.
The fundamentals are in place; we just have to wait and see if the demand zone holds.
BE AWARE, this is the Dollar Index, which means all other major currencies, especially EURUSD, will be affected if this scenario plays out.