Hello, this is Chartist🥰
Today, I’d like to talk about something interesting, “The Fibonacci Ratio hidden in the emojis we use every day”.
But before we dive into that, let’s first explore the concept of Fibonacci and why it’s important in technical analysis.
The Fibonacci sequence is a series of numbers where each number is the sum of the two preceding ones : 1, 1, 2, 3, 5, 8, 13, 21, 34, 55, 89, and so on.
From this sequence, we can derive key ratios that are widely used in technical analysis to predict market movements.
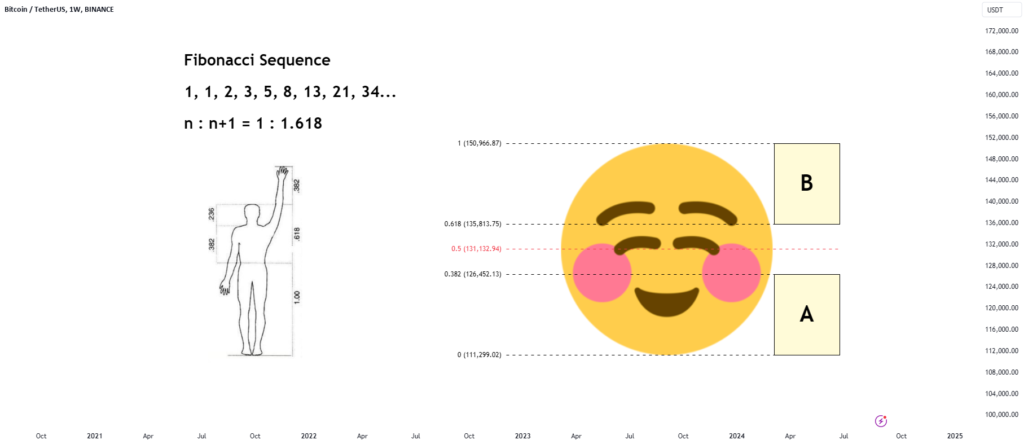
The ratio between any number and the next in the sequence is approximately 1:1.618, which is known for the Golden Ratio.
Here are some key Fibonacci ratios that are commonly used.
1. 0.618 (61.8%) : Often called as Golden Ratio, this is one of the most important Fibonacci levels. It frequently appears when prices retrace after a significant move.
2. 0.382 (38.2%) : This ratio is derived by dividing one number in a sequence by the next two numbers, and it is considered an important level in price retracements.. It’s a critical level for price retracements.
3. 0.236 (23.6%) : The lowest common Fibonacci retracement level, which is useful for identifying smaller pullbacks.
4. 0.5 (50%) : Not technically a Fibonacci ratio, but it’s widely used by traders as an important retracement level.
Now, back to our emojis!
These simple, everyday icons are also designed with Fibonacci ratios in mind.
For example, if we measure an emoji’s face :
– The cheeks align with the 0.382 ratio.
– The eyes correspond to the 0.5 ratio.
– The eyebrows match the 0.618 ratio.
– The heights of certain features, like points A and B on the face, are equal at 0.382.
In technical analysis, these ratios help identify potential support and resistance levels, making them crucial for predicting market behavior.
Just as these ratios are hidden in emojis, they are embedded in market patterns, guiding traders in making informed decisions.
The Fibonacci sequence also reveals interesting patterns shown as below.
1. The sum of two consecutive numbers equals the next number.
2. The 0.618 ratio, or Golden Ratio, is constant across the sequence (e.g., 21/34 = 0.618).
3. Dividing a number by one two places ahead gives 0.382 (e.g., 21/55 = 0.382).
4. The inverse of 0.618 is 1.618, and the inverse of 0.382 is 2.618.
5. In Elliott Wave Theory, the impulse wave (5-3-5-3-5) totals 21, and the corrective wave (5-3-5) totals 13, which sum to 34—a Fibonacci number.
So, as you can see, Fibonacci ratios aren’t just theoretical—they’re everywhere, even in the emojis we use!
This further underscores their importance in technical analysis, where they can help identify key market levels and potential turning points.
If you enjoyed this fun post, please don’t forget to like and leave a comment🤭
Thank you!


