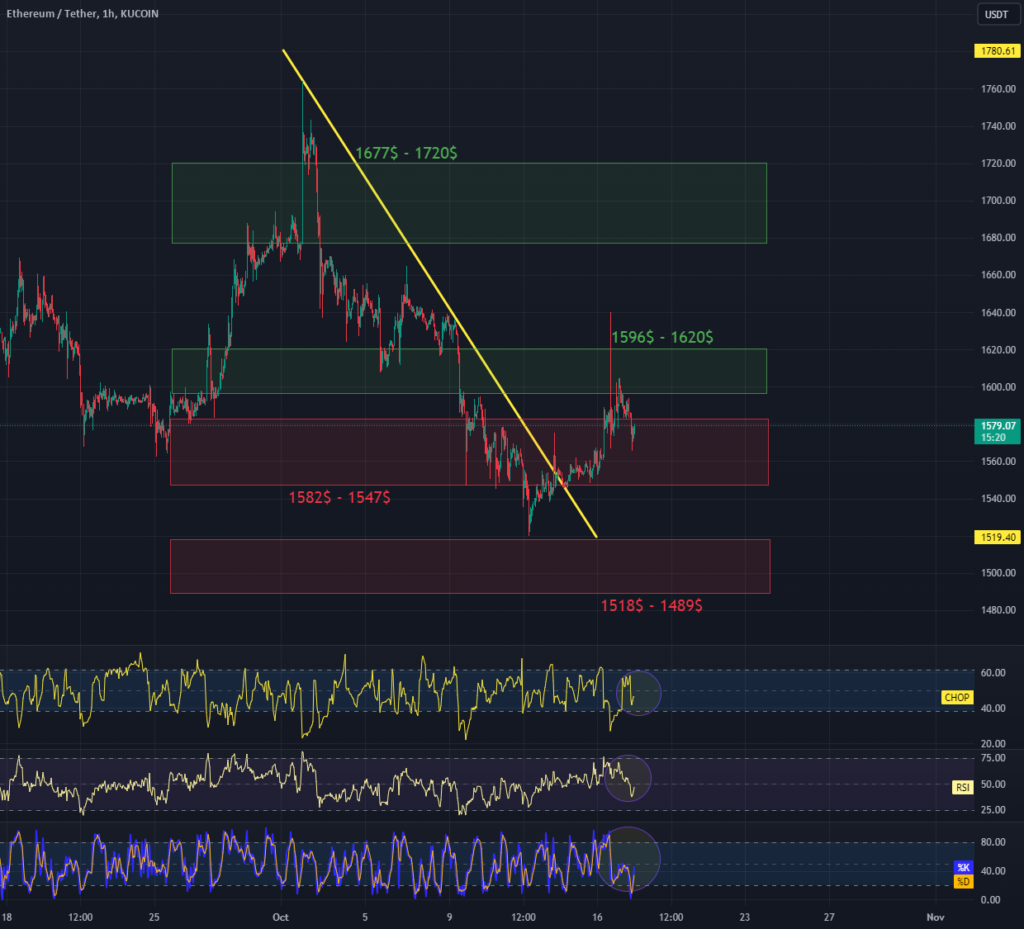
Hello everyone, let's take a look at the ETH to USDT chart on a one hour time frame. As you can see, the price is moving above the local downtrend line. After unfolding the Trend Based Fib Extension grid, we see that the price has retreated to the support zone from $1,582 to $1,547, and then there is a second zone from $1,518 to $1,489. Looking the other way, first we have a resistance zone from $1,596 to $1,620, and then the price will again try to break the zone from $1,677 to …

ETH/USDT 1H Chart Review for KUCOIN:ETHUSDT by cryptodailyuk
Hello everyone, let's take a look at the ETH to USDT chart on a one hour time frame. As you can see, the price is moving above the local downtrend line. After unfolding the Trend Based Fib Extension grid, we see that the price has retreated to the support zone from $1,582 to $1,547, and…
Shares:

